

The Problem: IT services marketing teams track vanity metrics - impressions, clicks, lead volume - that don't predict revenue. Sales ignores 80% of marketing leads because they're unqualified. CFOs ask "where's the ROI?" but marketers can't answer. Last-click attribution gives 100% credit to sales, making marketing invisible. Budget gets cut, leads dry up, and revenue drops.
The Solution: Focus on 4 KPI categories: (1) Pipeline metrics: Marketing-Influenced Revenue (30-60% benchmark), CAC ($536-$702), Pipeline Velocity ($1,847/day). (2) Lead Quality: MQL-to-SQL conversion (20-40% healthy, 50%+ high-performing), Sales Acceptance Rate (75%+). (3) Channel Performance: Channel-specific CAC (LinkedIn $380, Google $520, Email $53), ROAS by channel (3:1+ profitable). (4) Attribution: Use Position-Based 40-20-40 instead of last-click; credit awareness, nurturing, and close fairly.
The Impact: Mid-market IT services firm saw sales cycles compress 24% (89→68 days), CAC drop 27% ($850→$620), marketing-influenced revenue jump 190% (18%→52% of pipeline), and MQL-to-SQL conversion improve 288% (8%→31%). Result: $1.2M-$1.8M additional annual revenue from the same budget. Teams aligned, sales trusted marketing, CFO increased budget instead of cutting.
The Action: 90-day roadmap: Month 1: Audit tech stack, define MQL/SQL together, integrate systems. Month 2: Implement Position-Based attribution, identify best/worst channels, present ROI report. Month 3: Reallocate budget to winners, set up nurturing, measure results. Start with 5 core metrics; add complexity as you mature.
In March 2024, a solitary orca nicknamed Starboard did something that shouldn't be possible.
She spotted an 8-foot great white shark, the ocean's apex predator, and attacked it. Within two minutes, the shark was dead. Starboard carried its liver in her mouth like a trophy and swam away.
This shouldn't work. A single orca against the animal that has evolved for 11 million years to be the perfect killer. And yet, Starboard didn't just survive the encounter. She won decisively.
How? She had something no individual shark has: data.
Starboard's pod had spent years learning and refining a hunting technique. Flip the shark upside down. This triggers a neurological response called tonic immobility - the shark's body goes rigid. It can't fight back. The whole encounter was decided by understanding the precise mechanics of her prey.
Other orcas in the pod observed, learned, and practiced the same technique. They measured what worked and what didn't. The successful moves were repeated. The failures were abandoned. Each generation refined the approach.
That's not instinct. That's measurement. That's strategy.
Here's the thing: your IT services marketing team is probably doing the opposite.
You're tracking impressions, clicks, and lead volume, these metrics that make your dashboard look green but don't tell you how to close more deals or why your sales cycle is 89 days instead of 60.
You're optimizing for vanity.
The orcas are optimizing for outcomes.
Let's be honest: 80% of leads marketing goes cold. Your sales team ignores them. Not because they're lazy. Because most of those leads aren't actually qualified.
But here's the bigger problem: You don't know which leads are wasted or why.
You're drowning in data but starving for insight.
Your marketing team celebrates a 3% click-through rate. Your sales team complains the leads are garbage. Your CFO asks where the revenue is. Everyone's looking at different numbers, speaking a different language, and measuring different things.
The result? Marketing teams waste 30-40% of their budget on the wrong channels, wrong audiences, and wrong messages.
This isn't a marketing problem. It's a measurement problem.
Most IT services firms are measuring marketing like they're running a coffee shop: volume in, revenue out. But IT services sales aren't simple. Your deals take 67-89 days. Multiple stakeholders are involved. Technical proof points matter. Price alone doesn't move the needle.
When you're selling complex, high-stakes solutions, you need precision measurement. You need to know not just what happened, but why it happened and which channel really deserves credit for the win.
You need what Starboard the orca had: a system that separates signal from noise.
You're tracking:
But you're not tracking:
The difference between these two groups is stark. One tells you how much activity you're creating. The other tells you whether that activity is converting into revenue.
Here's what happens when you measure the wrong KPIs:
Your sales team gets frustrated because 80% of leads are unqualified, so they stop paying attention to marketing entirely. They go back to doing what they know works: calling their network, chasing inbound RFPs, and working deals they find themselves.
Marketing, meanwhile, is celebrating the volume they're generating and wondering why sales isn't grateful.
Your CFO is confused about the ROI because marketing says it generated 1,000 leads this month while sales says only 50 were worth working. Nobody can agree on the numbers.
Deals stall. Forecasts become fiction. Your best people leave because there's no clear strategy—just chaos.
Now here's where it gets even more complicated: IT services marketing isn't one-channel anymore.
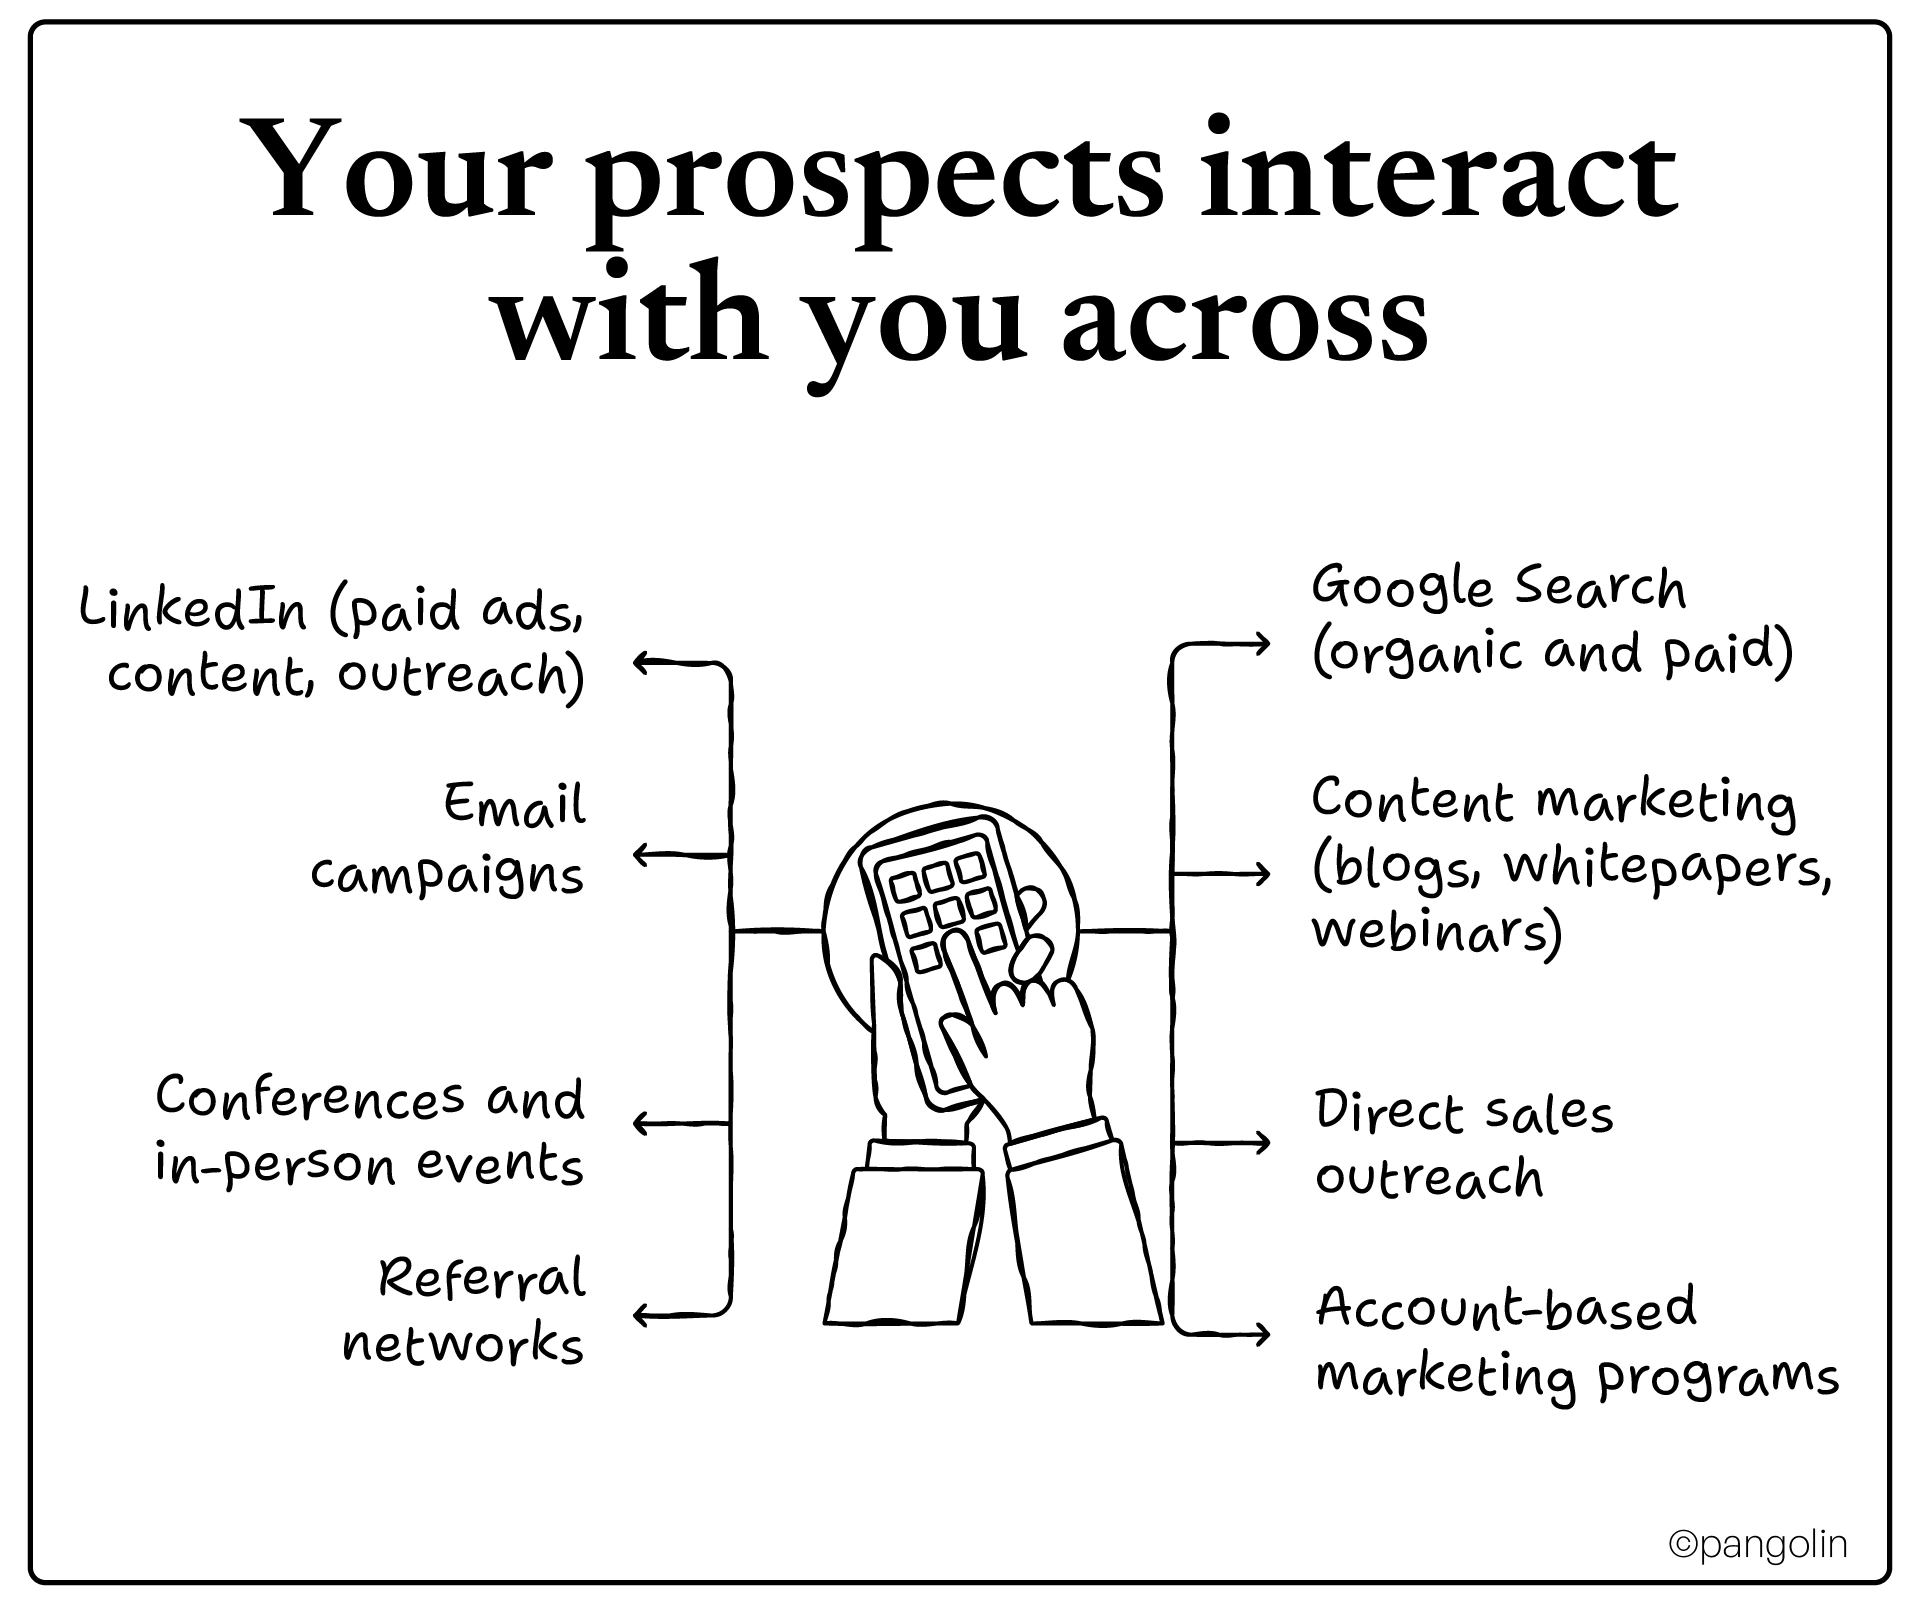
Your prospects interact with you across:
A prospect might see your LinkedIn ad on Tuesday, read your blog on Thursday, attend your webinar on Friday, and get a sales call on Monday. By the time they close a deal eight weeks later, they've touched your brand across five different channels.
So when they sign the contract: which channel gets credit?
Last-click attribution says it's the sales call. But the sales call wouldn't have happened without the LinkedIn ad and the blog that built credibility first.
Most IT services firms default to last-click attribution giving 100% credit to whichever channel interacted with the prospect most recently. This creates a financial illusion where your sales team looks like the revenue-generating machine and marketing looks like a cost center.
Your CFO starts cutting the marketing budget. Leads dry up. Sales burns out chasing fewer opportunities. Revenue drops.
And it all traces back to a broken measurement system.
Let's use a real scenario:
The Prospect's Journey (The Reality):
What Your Tools Say Happened:
What Your Team Argues About:
The Problem: All three are right and all three are measuring different things.
The Solution: Multi-touch attribution that credits each channel based on its actual role in the journey.
Most blogs will give you 23 KPIs to track. That's overwhelming and useless. You'll track them all, understand none of them, and act on zero of them.
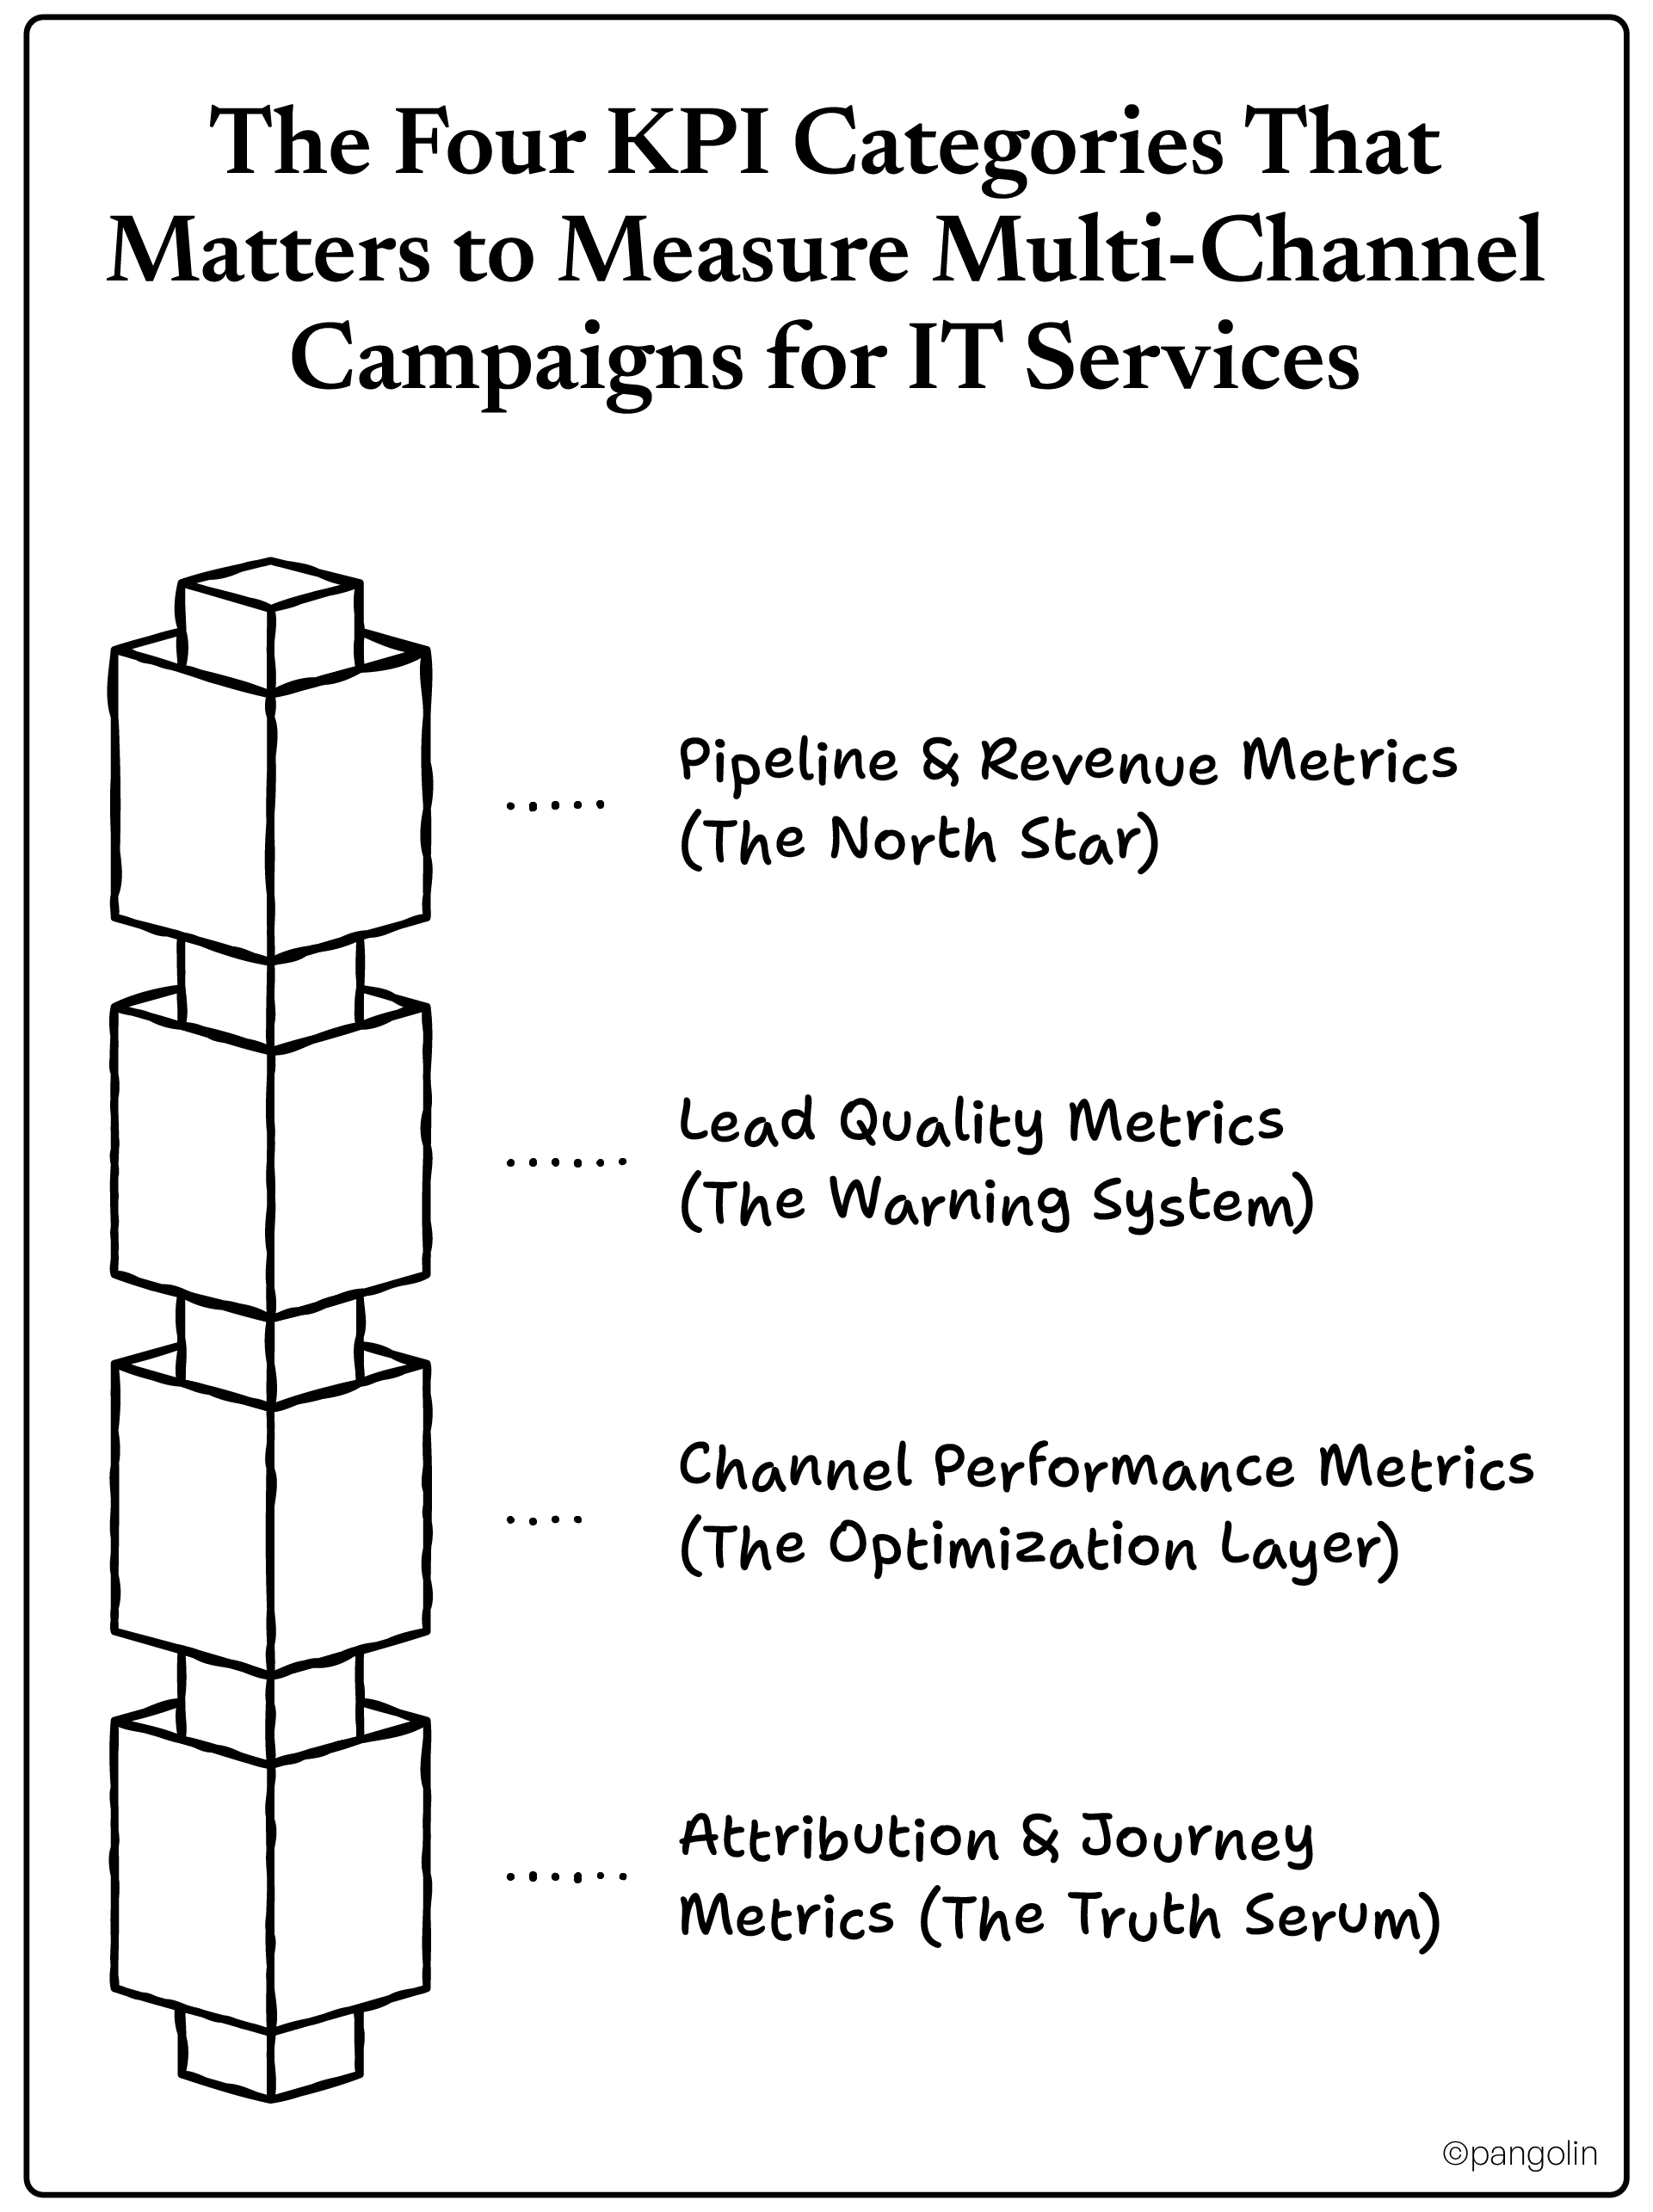
Instead, let's focus on the four categories that directly impact your bottom line:
These are the only metrics that ultimately matter:
Marketing-Influenced Revenue (MIR): What percentage of your closed deals had a marketing touchpoint somewhere in the journey?
Industry benchmark: 30-60% of pipeline should be influenced by marketing
Why it matters: This proves marketing's true value. If marketing is only influencing 15% of deals, you've got a visibility problem. If it's influencing 70%, you're punching above your weight.
Customer Acquisition Cost (CAC): How much are you spending to acquire one customer?
Formula: (Marketing spend + Sales spend) / New customers acquired
Industry benchmark for IT services: $536-$702 per customer
Why it matters: If your CAC is rising while your deal size stays the same, your efficiency is tanking. You're spending $700 to acquire a customer worth $10,000 in Year 1 revenue. That's bad math. (Or in some cases, brilliant long-term math if LTV is high—but you need to know which one.)
Sales Pipeline Velocity: How fast is money moving through your funnel?
Formula: (Avg Deal Size × Win Rate) / Sales Cycle Length (in days)
Industry benchmark for IT services: $1,847 per day
Why it matters: This tells you if your deals are accelerating or stagnating. If your velocity dropped 30% this quarter, something broke and you need to fix it before revenue craters next quarter.
These metrics tell you whether your funnel is healthy or broken:
Lead-to-MQL Conversion Rate: What percentage of leads actually qualify as marketing qualified?
Industry benchmark: 5-15% of leads become MQLs
Formula: MQLs generated / Total leads sourced
Why it matters: If you're generating 1,000 leads but only 30 are MQL-worthy (3%), you're wasting 97% of your lead generation effort. This points to a targeting problem, not a lead generation problem.
MQL-to-SQL Conversion Rate: What percentage of marketing-qualified leads actually become sales-qualified?
Industry benchmark: 20-40% of MQLs become SQLs; high performers: 50%+
Formula: SQLs accepted / MQLs passed to sales
Why it matters: This is where marketing and sales alignment is most visible. If sales is rejecting 90% of your MQLs, you have a mismatch. Either marketing is defining MQL wrong, or sales isn't following up. Either way, you're leaking revenue.
Sales Acceptance Rate (SAR): What percentage of leads marketing passes to sales do sales actually accept?
Industry benchmark: 75%+ indicates healthy alignment
Formula: Accepted leads / Total leads passed to sales
Why it matters: If SAR is 40%, sales and marketing are fundamentally misaligned. This is the loudest warning signal that your measurement system is broken.
These metrics tell you which channels are actually profitable:
Channel-Specific CAC: How much does it cost to acquire a customer through each channel?
Example benchmarks:
Why it matters: If LinkedIn Ads are delivering customers at $380 while your event marketing costs $1,200 per customer, you should reallocate the budget immediately. But most firms don't know these numbers.
Channel Conversion Rates: What percentage of people exposed to each channel actually convert to leads?
Example benchmarks:
Why it matters: If your LinkedIn conversion rate is 0.5% while email is 4.77%, you're either running bad LinkedIn campaigns or using email incorrectly. Either way, this tells you where to focus your optimization effort.
Return on Ad Spend (ROAS) by Channel: For paid channels, how much revenue comes back for every dollar spent?
Formula: Revenue attributed to channel / Ad spend on that channel
Industry benchmark: Profitable ROAS is typically 3:1 or better
Why it matters: If Google Search ROAS is 5:1 but LinkedIn is 1.2:1, you're pouring water into a bucket with a hole in it.
These metrics answer the question: "Which channel actually deserves credit for this deal?"
Multi-Touch Attribution Model: This is where the real complexity lives.
The most common models are:
For IT services with 67-89 day sales cycles and 6-10 stakeholders, Position-Based or Time-Decay attribution is typically most accurate.
Marketing-Assisted Conversions: How many deals had a marketing touchpoint somewhere, even if sales closed the deal?
Why it matters: This prevents sales from claiming they "own" all revenue. It's the single most important metric for proving marketing's value.
Average Number of Touchpoints to Close: How many interactions does a prospect need before they buy?
Industry benchmark for IT services: 8-12 touchpoints
Formula: Sum of all touchpoints across closed deals / Number of closed deals
Why it matters: If your average is 3 touchpoints, you're probably not doing enough nurturing. If it's 25+, you've got a problem somewhere in the buying process.
Now let's tie this together into a simple dashboard that actually matters:
The worst position to be in is measuring KPIs with no idea if your numbers are good or bad.
Here's a quick benchmarking checklist for IT services:
If your firm is tracking to the left, you're bleeding money.
If you're in the middle, you're competitive.
If you're on the right, you're outpacing competitors by 2-3x.
Okay, you're convinced these metrics matter. Now the hard part: implementing them.
Here's a simple roadmap that won't require you to restructure your entire company:
Week 1:
Week 2:
Week 3-4:
Success Metric for Month 1: Both teams are using the same CRM, agree on lead definitions, and have reviewed the pipeline together at least twice.
Week 1:
Week 2:
Week 3:
Week 4:
Success Metric for Month 2: You know which channel delivers the most profitable customers. You have multi-touch attribution working. You have a repeatable monthly reporting cadence.
Week 1-2:
Week 3:
Week 4:
Success Metric for Month 3: Your pipeline velocity is trending up. Your CAC is trending down. Sales cycle is compressing. Most importantly: both teams are aligned on metrics, looking at same data, and making decisions together.
Let's get concrete about what this investment pays back:
Company Profile: Mid-market IT services firm, $80M revenue, $400K/month marketing budget
That's not marginal improvement. That's transformation.
You'll be tempted to track 50 KPIs. Don't.
Pick 3 metrics that matter most to your business:
Master these three. Everything else is noise.
Your data won't be perfect. Your CRM has duplicates. Your marketing automation has gaps. Your attribution will never be 100% accurate.
Start anyway. Imperfect data beats no data.
You can have the most sophisticated attribution model in the world, but if sales and marketing don't agree on what defines a qualified lead, it's worthless.
Alignment comes before analytics.
If you optimize for volume (leads), you'll get lots of garbage leads.
If you optimize for cost (cheapest leads), you'll get the lowest quality.
Optimize for profitable customers and let the other metrics follow.
You'll set up your KPI system and think you're done. You're not.
Measurement is continuous. Every quarter, review what's working and what isn't. Double down on what's working. Kill what isn't.
Starboard the orca didn't get lucky when she hunted that great white shark. She succeeded because her pod had spent years measuring, learning, and refining their approach.
Your IT services marketing can do the same thing.
But not with impressions and clicks. Not with vanity metrics that look good but don't predict revenue.
You need precision measurement that shows you:
You need a system that stops guessing and starts knowing.
The companies doing this—the ones measuring the right KPIs across their multi-channel campaigns—are closing deals 21% faster and acquiring customers 27% cheaper than their competitors.
They're also outgrowing the market by 2-3x.
That's not luck. That's a data-driven strategy at work.
The question isn't whether you can afford to implement this system.
The question is: Can you afford not to?
Start here: Have your marketing and sales teams sit down and answer these three questions:
If you can't answer these questions with confidence, you've found your starting point.
That's Month 1.
Pangolin Marketing specializes in turning chaotic marketing operations into predictable revenue engines for IT services firms. If your team is ready to move beyond vanity metrics to real measurement, we can help.

