

Flamin' Hot Cheetos.
The spicy snack that took the snack world by storm. And you know what’s wild? Apart from the wild cat on the packet.
It was invented by a janitor who pitched his fiery snack idea directly to the CEO. With no formal marketing playbook, little budget, and zero top-down backing, this one idea exploded into a multi-billion-dollar brand, reshaping the snack aisle forever.
It’s a powerful reminder: sometimes the biggest game-changers come from unexpected places. But they need the right attention, resources, and measurement to catch fire.
Now, imagine if your marketing data hides equally powerful insights waiting for you to uncover them. The problem? Most IT marketers don’t even know where or how to find these hidden gems.
Your CAC calculation is lying to you. Most IT companies think their customer acquisition cost is about $300, but the truth is closer to $850 once you factor in hidden costs and flawed attribution.
Companies lose 40-60% of their marketing budget to these blind spots. They pour money into the wrong channels, miss the ones that matter, and struggle to prove marketing’s real impact.
Here’s how top IT marketers are fixing this, taking control of their CAC with clarity, precision, and confidence.
Imagine trying to close a deal that involves not one, not two, but seven decision-makers, each from different teams with different goals. That’s everyday life in IT sales. And these deals don’t happen overnight; they often stretch for 60 to 90 days, sometimes longer.
Here’s a real story: Marketing launches a campaign and lands a hot lead in month one. But the deal doesn’t close until five months later, after rounds of technical reviews, budgeting, and approvals. Who gets the credit? Marketing brought in the lead, but sales closed the deal five months down the line.
This long, multi-stakeholder dance turns simple monthly CAC calculations into a guessing game. The usual formula, spend divided by conversions each month, misses these time gaps and warps the true cost of acquiring a customer.
Most marketing teams calculate CAC based on marketing spend alone. But the truth is, that’s just the tip of the iceberg. Total CAC for IT companies also includes:
Add those up, and your full CAC can be as much as 83% higher than the simple marketing spend figure. These numbers aren’t just guesses, they come from benchmarks across hundreds of IT firms tracking full customer lifecycles.
Here’s a tough but crucial truth: a lot of IT companies still rely on ‘last-click’ attribution. That means giving all the credit to the last touchpoint that got a click, ignoring the six or seven earlier interactions that built interest and trust.
The result? Up to 70% of your customer journey is missing from your metrics. This blind spot sends you pouring money into the wrong channels while the real drivers get starved.
One SaaS company we worked with believed Google Ads powered their lead gen. After switching to multi-touch attribution, they discovered LinkedIn was actually their biggest converting channel, doubling qualified leads and completely changing their marketing strategy.
In IT marketing, details win. Get your CAC right, and you change not just the numbers, but where and how you invest to win.
Tracking and optimizing CAC in IT marketing can feel like solving a Rubik's Cube blindfolded, until you break it down into a clear process. Here’s a simple, 7-step system that transforms complexity into clarity and action.
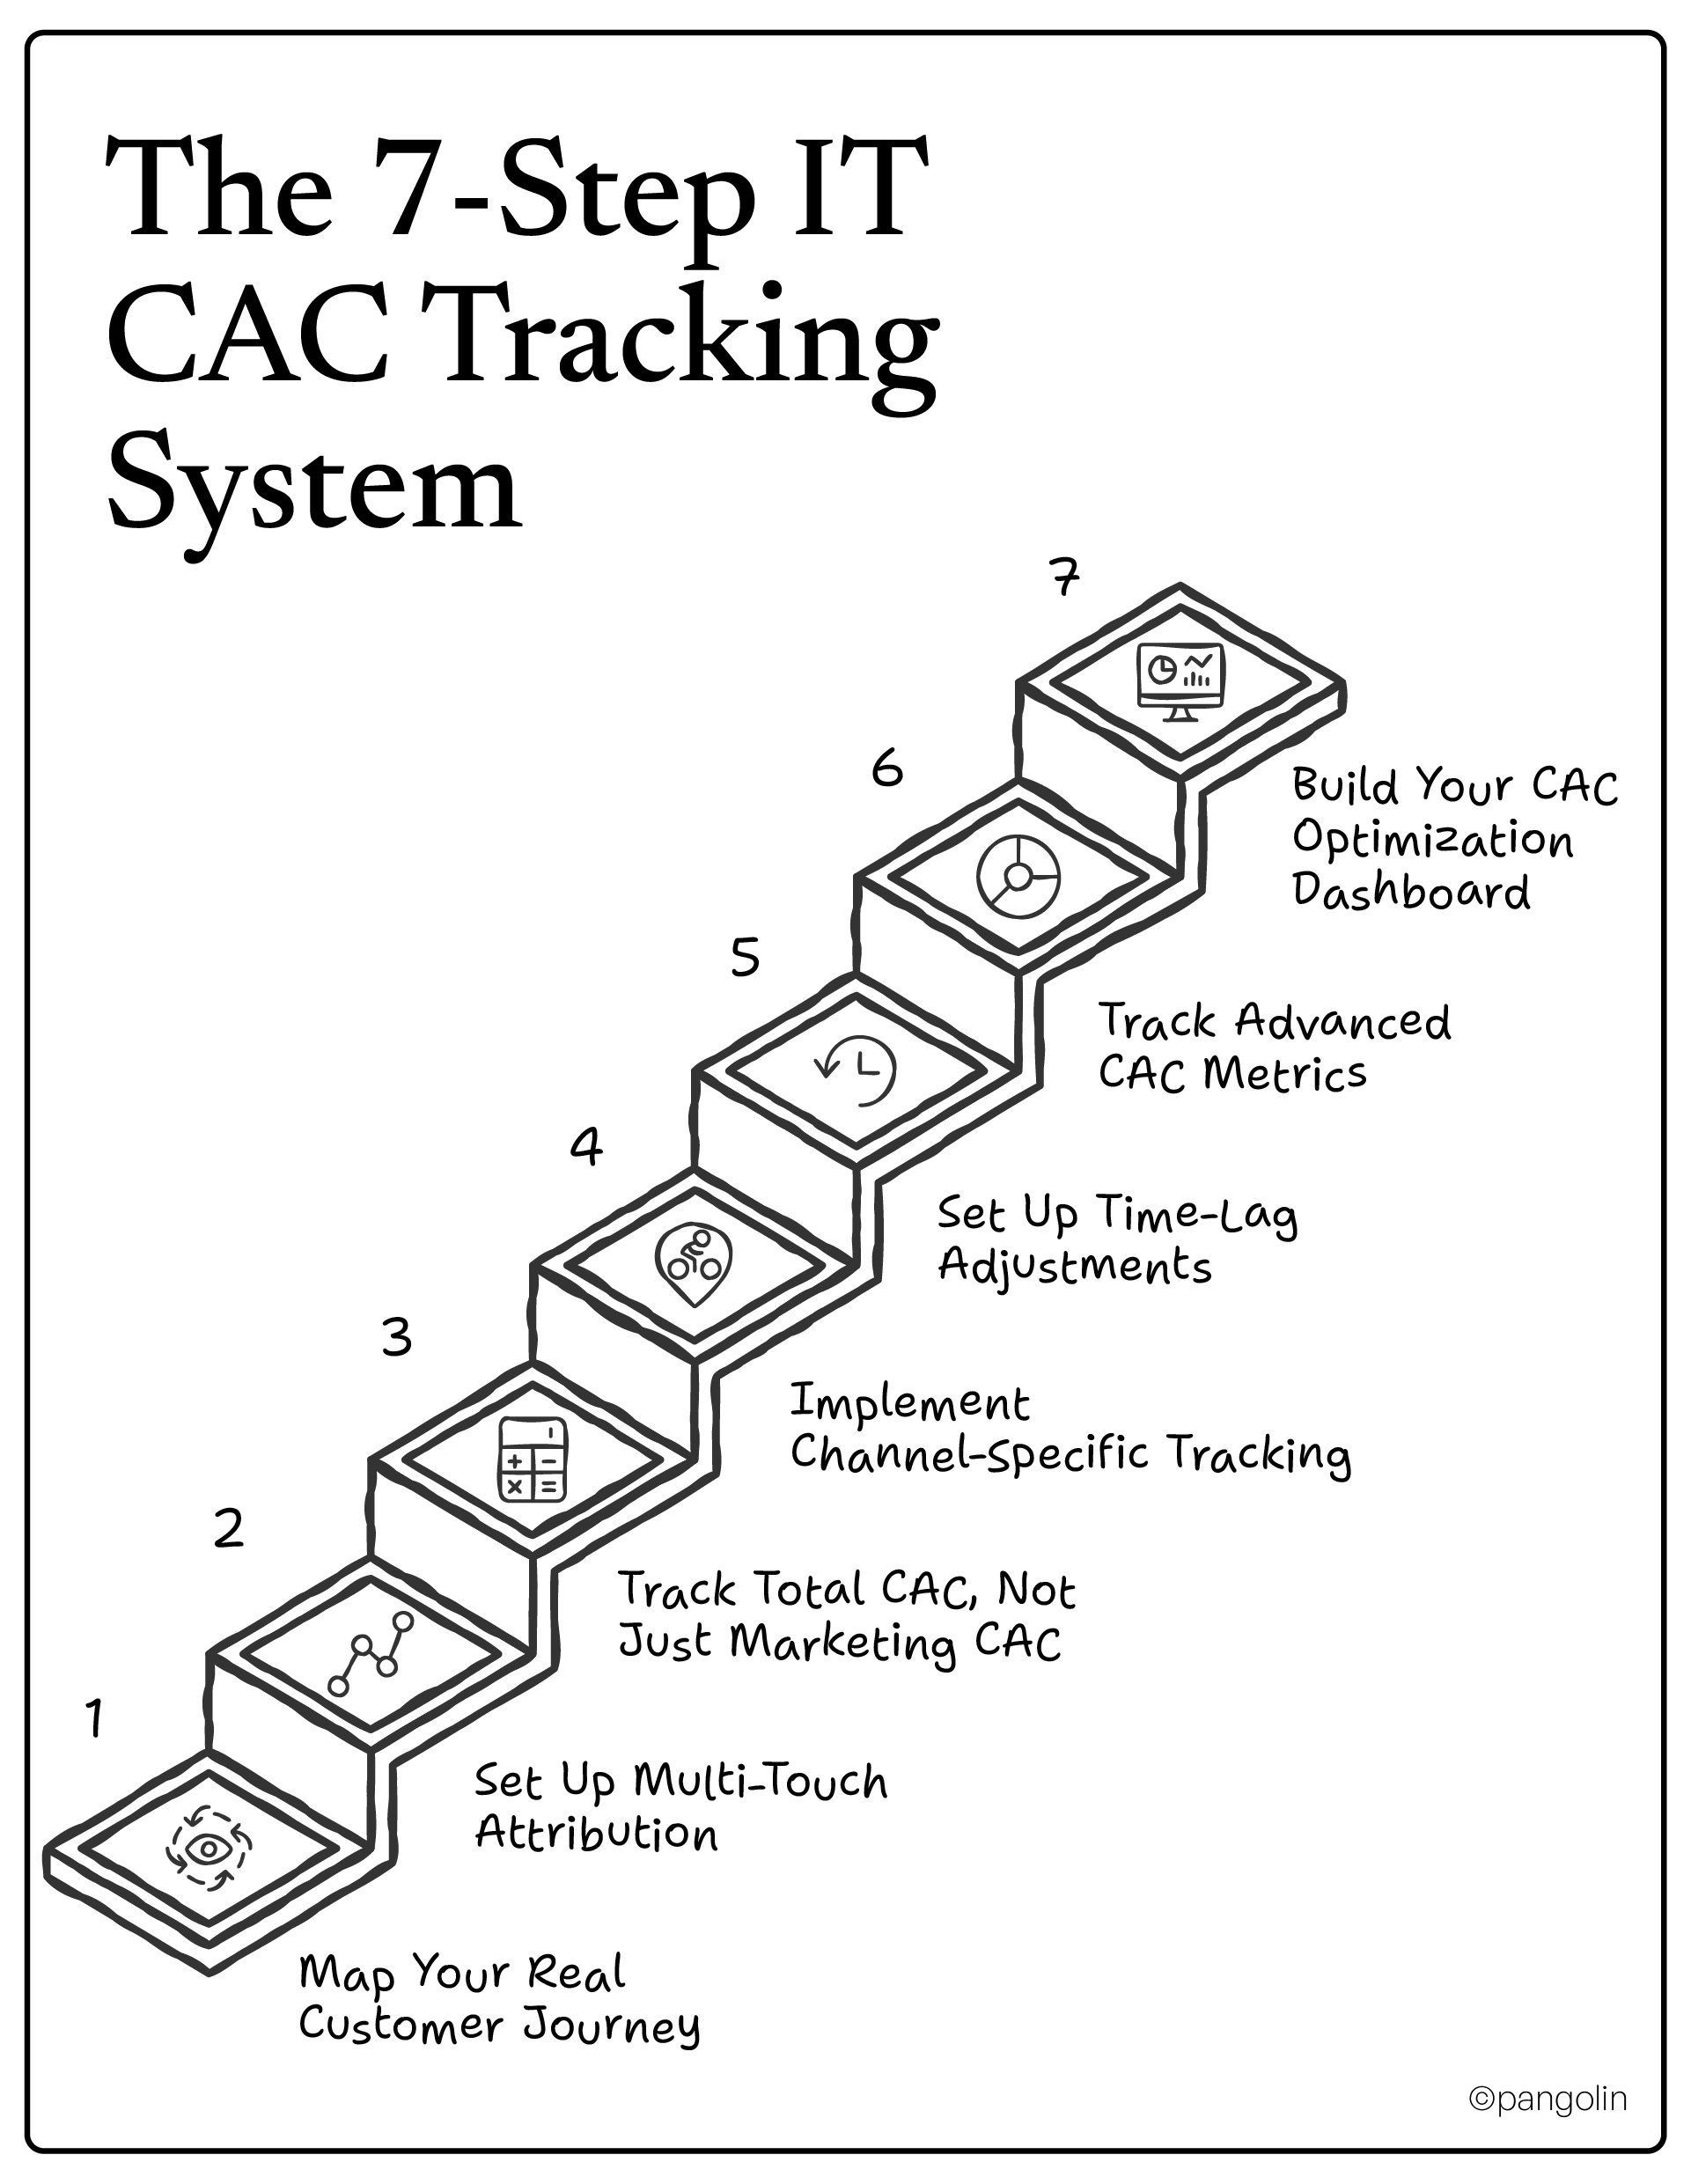
Tracking CAC starts with knowing every step your customer takes. Document every touchpoint, from the first awareness click, through demos, technical reviews, and pricing talks, all the way to a closed-won deal.
Forget last-click attribution, it’s outdated. Use tools like HubSpot, Google Analytics, and UTM parameters to assign credit to every touchpoint that influences a sale.
This is crucial: include sales and onboarding costs alongside your marketing spend. Here’s the simple formula:
(Marketing Spend + Sales Costs + Onboarding Costs) ÷ Customers Acquired = Total CAC
Know your battlefield. Track CAC by channel to optimize your spend where it counts most. For many IT companies, the breakdown looks something like this:
Deals don’t close the day a lead clicks; they take time. With 3-month lag times being common in IT, monthly CAC snapshots are misleading.
Go beyond the basics and track the metrics that truly matter to the business:
The final step is to bring it all together. Create a dashboard that consolidates these key metrics for easy, real-time insights.
Tracking CAC is one thing; actively driving it down is where the real magic happens. This isn’t about throwing more money at the problem, it’s about making smarter, data-backed decisions. Here’s how the sharpest IT marketers are winning today by mastering what really moves the needle.
Stop throwing money at LinkedIn just because everyone else is. The truth is, what works for a huge enterprise chasing massive deals is completely different from what works for a mid-market company. Knowing your ideal channel mix can save you a fortune and dramatically lower your CAC.
Here are some credible benchmarks based on deal size:

Why does this work? Content is king in IT, especially for big-ticket decisions. It builds authority and fuels your SEO. LinkedIn is fantastic for keeping your brand in front of key decision-makers. And for enterprise sales, the high cost of events is often justified by the high-intent leads they generate.
What if you could cut your CAC by an average of 37%? According to 2025 marketing automation research, that's the kind of impact AI is having. This isn't science fiction; it's happening right now with concrete tools that give marketers an almost unfair advantage.
Think about tools like:
The best part? You don’t need to overhaul your entire department overnight. Start small. Implement AI-powered optimization on a single channel, like Google Ads. Once you see the results, you can gradually roll it out across the board. This phased approach keeps the risk low and builds confidence as you go.
Every marketer knows the feeling: you generate a lead, pass it to sales, and then hear crickets… or worse, get blamed for "bad leads." It's one of the most frustrating and emotionally draining parts of the job.
The fix is to change the conversation from "marketing-sourced" to "marketing-influenced." A simple but powerful metric to track here is your Marketing Influenced Pipeline (MIP) percentage. This metric shows the total pipeline that marketing has touched in some meaningful way, regardless of who sourced the lead.
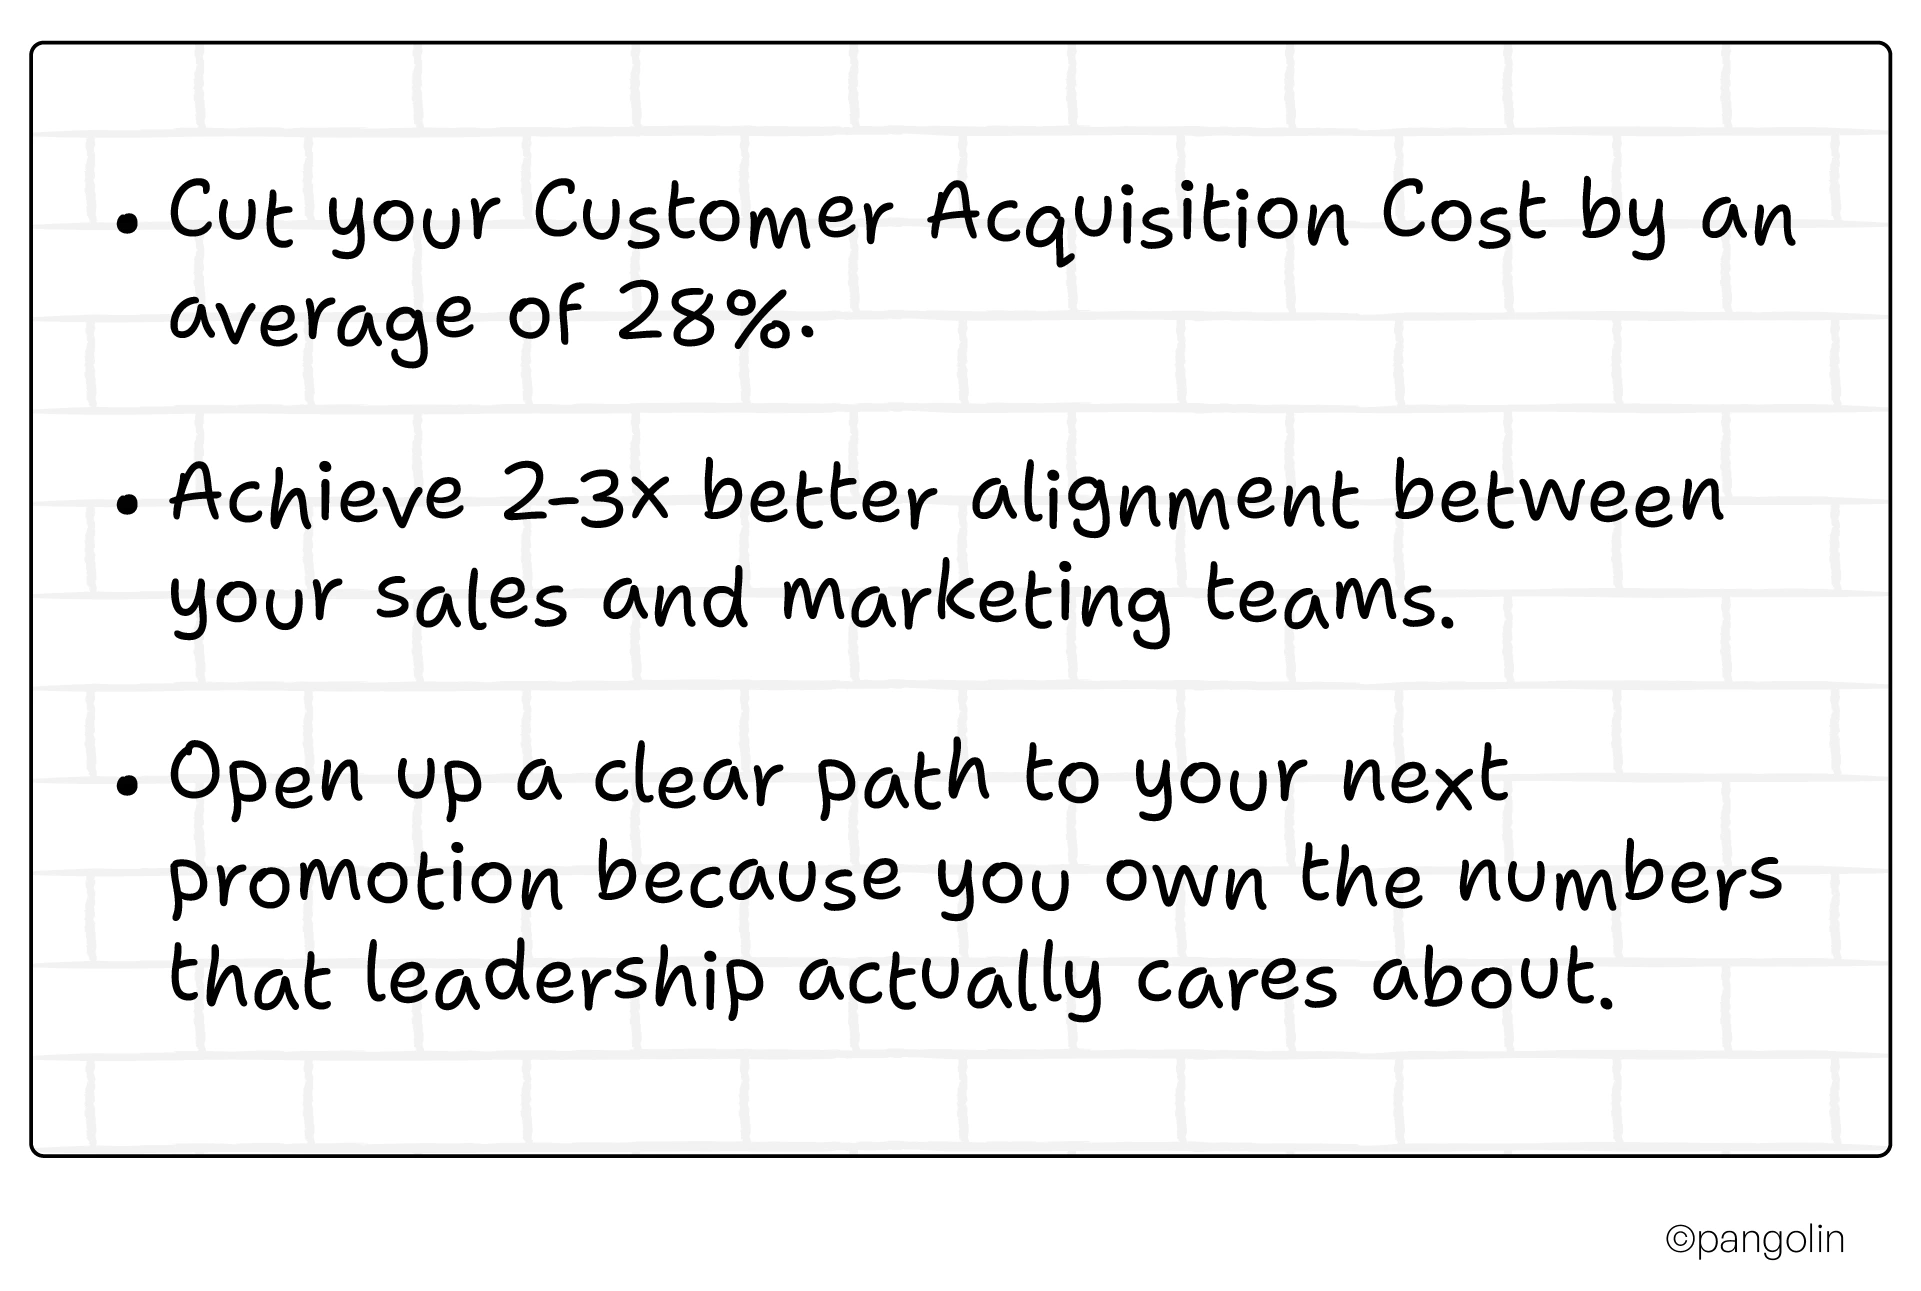
By shifting to an account-based attribution model, you stop arguing over who gets credit for a single lead and start looking at how marketing and sales worked together to win the entire account. This approach doesn't just make for better reports; it builds real partnership. Companies that get this right see a 2-3x improvement in sales and marketing alignment, turning finger-pointing into a unified push toward revenue.
Mistakes in CAC tracking are costly and incredibly common. The good news is that they are also easy to fix once you know what to look for. Avoiding these simple traps can save your marketing budget, your sanity, and maybe even your job.
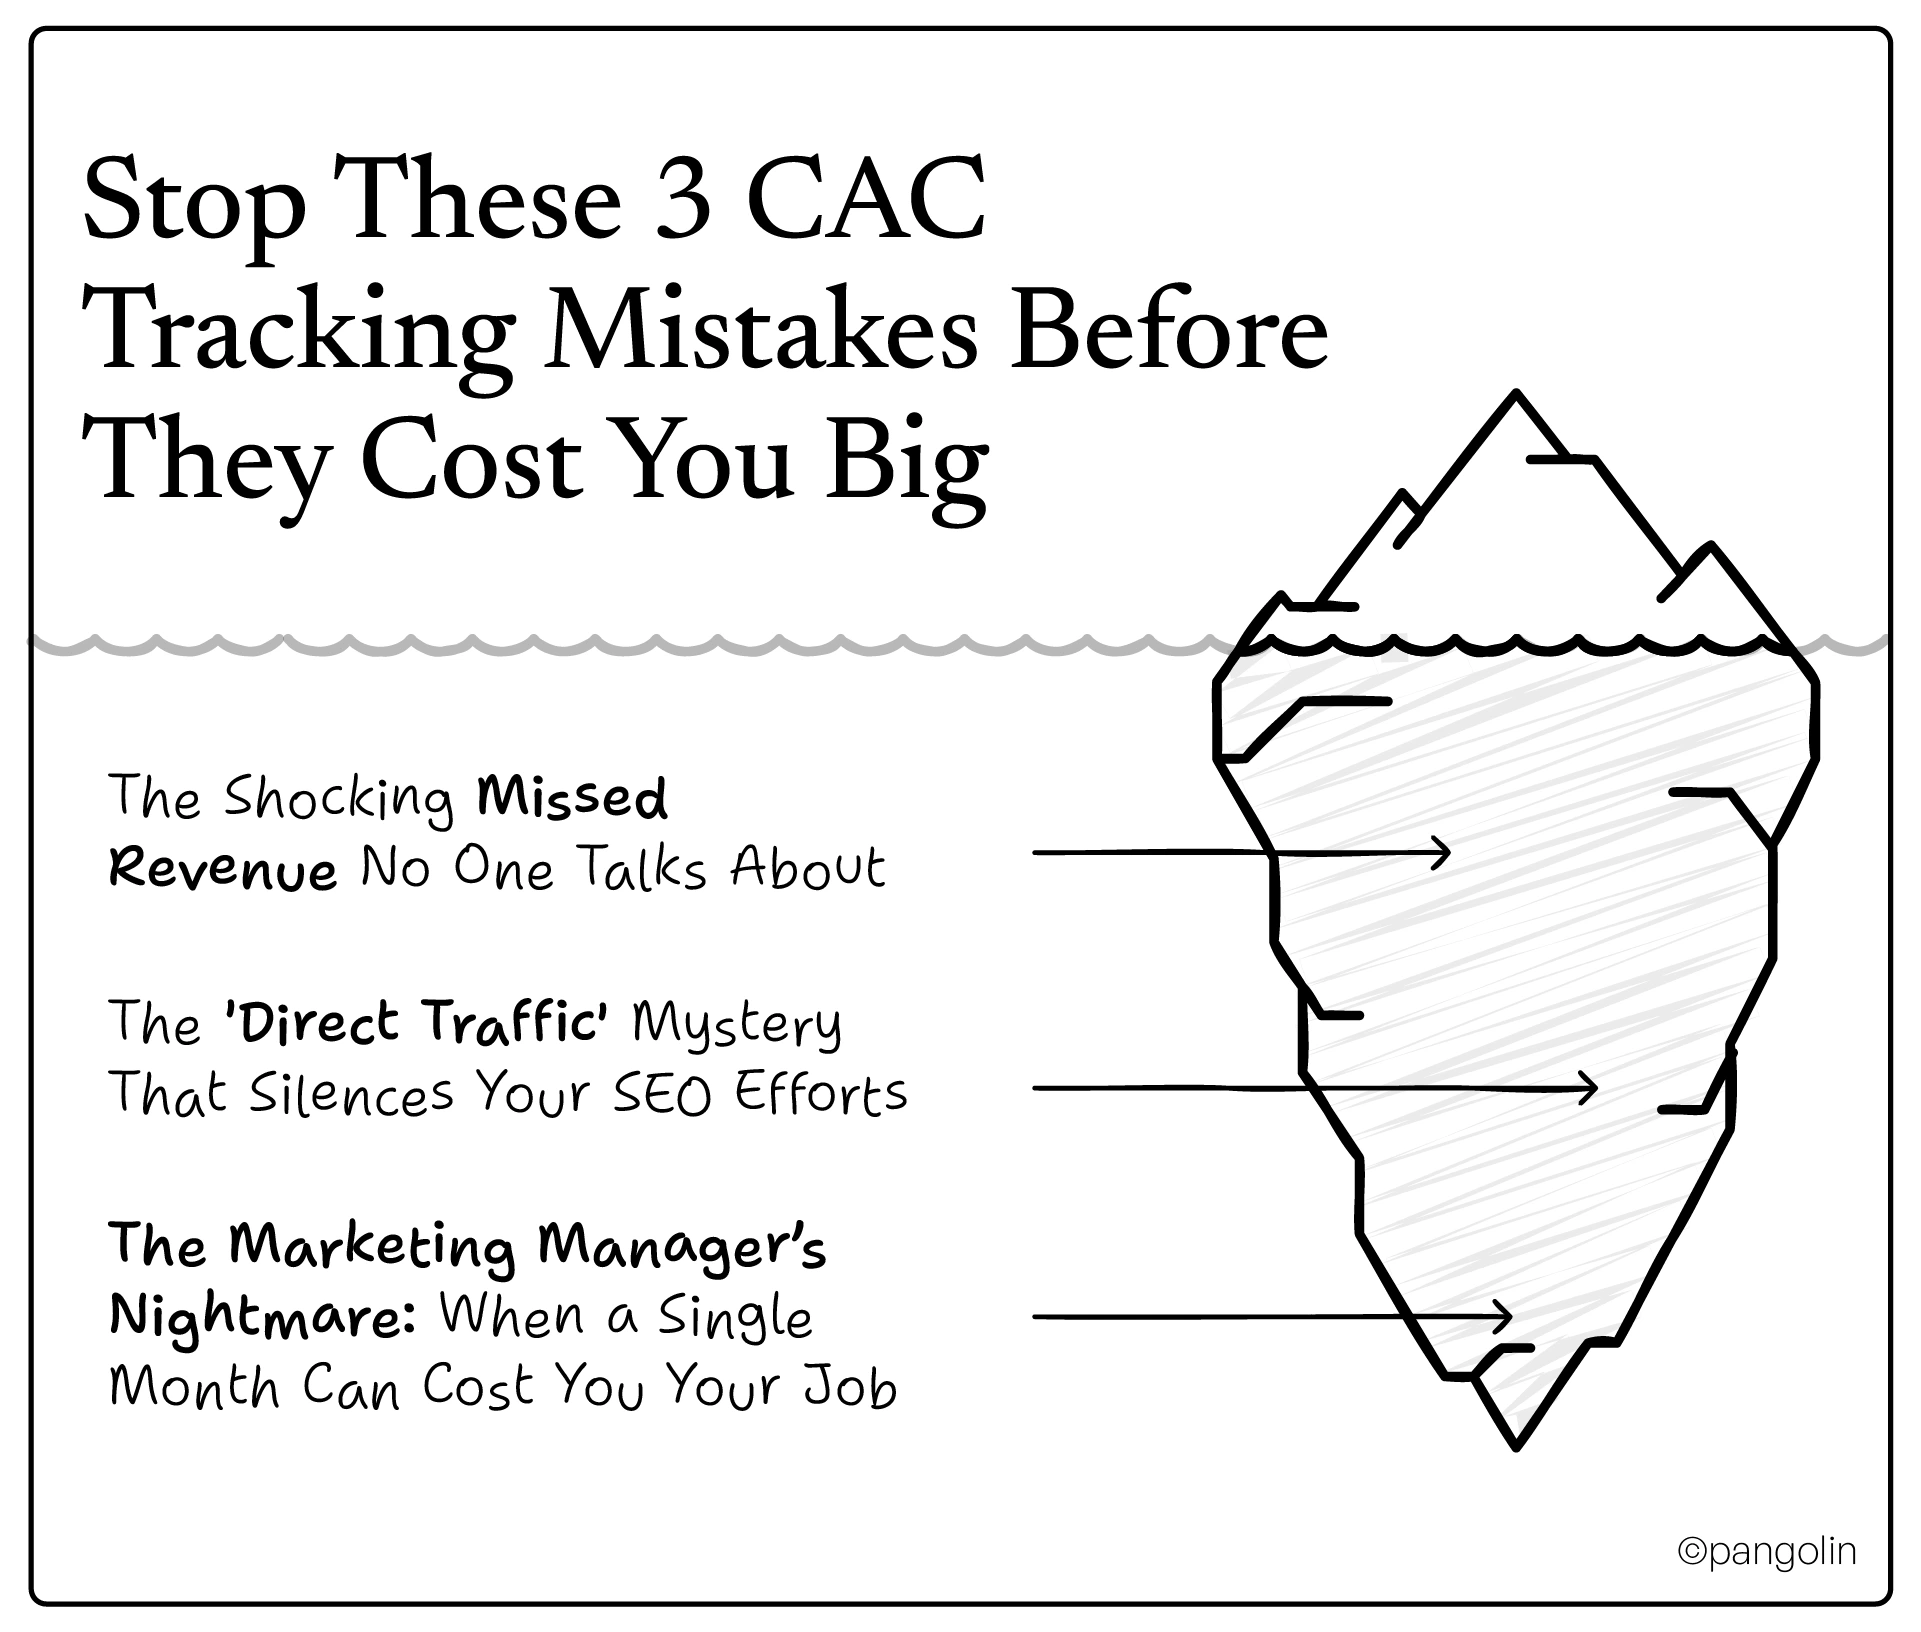
Here’s a story we see all the time: a fast-growing software company was celebrating what they thought were stellar, low CAC numbers. The marketing team was getting high-fives in meetings. Yet, overall revenue wasn't growing as fast as their "new customer" numbers suggested. The problem? They only tracked the cost to acquire brand new customers. They completely overlooked expansion revenue, the upsells, renewals, and add-ons from existing clients that actually drove 40% of their total revenue.
Ignoring expansion CAC creates a massive blind spot. Bringing in more business from current customers is almost always cheaper than finding new ones, and it significantly boosts overall profitability. Without tracking it separately, you get a distorted view of your marketing ROI and might underinvest in the very retention and upsell campaigns that are driving your bottom line.
The simple fix: Always track New Customer CAC and Expansion CAC as two separate metrics. This small change helps you allocate your budget with precision and gives you full credit for the revenue you’re actually generating.
Many marketing teams look at their analytics and see a huge chunk of traffic labeled as "direct." It feels good at first: you assume these are loyal, brand-aware visitors typing your URL straight into their browser. But this "direct" bucket often becomes a black hole where your most successful organic and referral efforts disappear without a trace.
Years of hard work building SEO authority and creating valuable thought leadership content can be working silently behind the scenes, but if you can't track it, you can't prove it. This leads to an inflated CAC number and missed opportunities to double down on the organic channels that are quietly driving high-quality leads. For example, one B2B SaaS firm we know thought their direct traffic was just loyal users, but after digging in, they realized a huge portion was coming from branded search terms and untagged links in their content marketing.
The simple fix: Use a consistent UTM-tagging strategy for all your campaigns, not just paid ones, and carefully analyze your branded search data. This brings your hidden traffic sources out of the shadows and gives your long-term SEO and content investments the credit they deserve.
Here's a cautionary tale: a marketing manager was fired after a single month’s report showed a scary spike in CAC. Leadership panicked, assuming the marketing strategy was failing. What they didn’t realize was that the spike was just a seasonal blip caused by a competitor's product launch, not a systemic problem.
In IT, CAC can fluctuate naturally due to market cycles, big industry events, or sales campaigns. Relying on simple monthly CAC snapshots is a recipe for knee-jerk reactions, painful budget cuts, sudden strategy shifts, and unwarranted blame.
The simple fix: Use rolling 3- to 6-month averages for your CAC calculations. This smooths out the natural ups and downs and reveals the true trends in your acquisition costs, giving you the confidence and stability to make smart, long-term decisions.
Ready to stop guessing and start knowing your real CAC? This isn't a six-month overhaul. It's a 30-day playbook that breaks down the chaos into four simple, focused weeks. Each week, you’ll nail a key pillar of an unstoppable CAC tracking system.
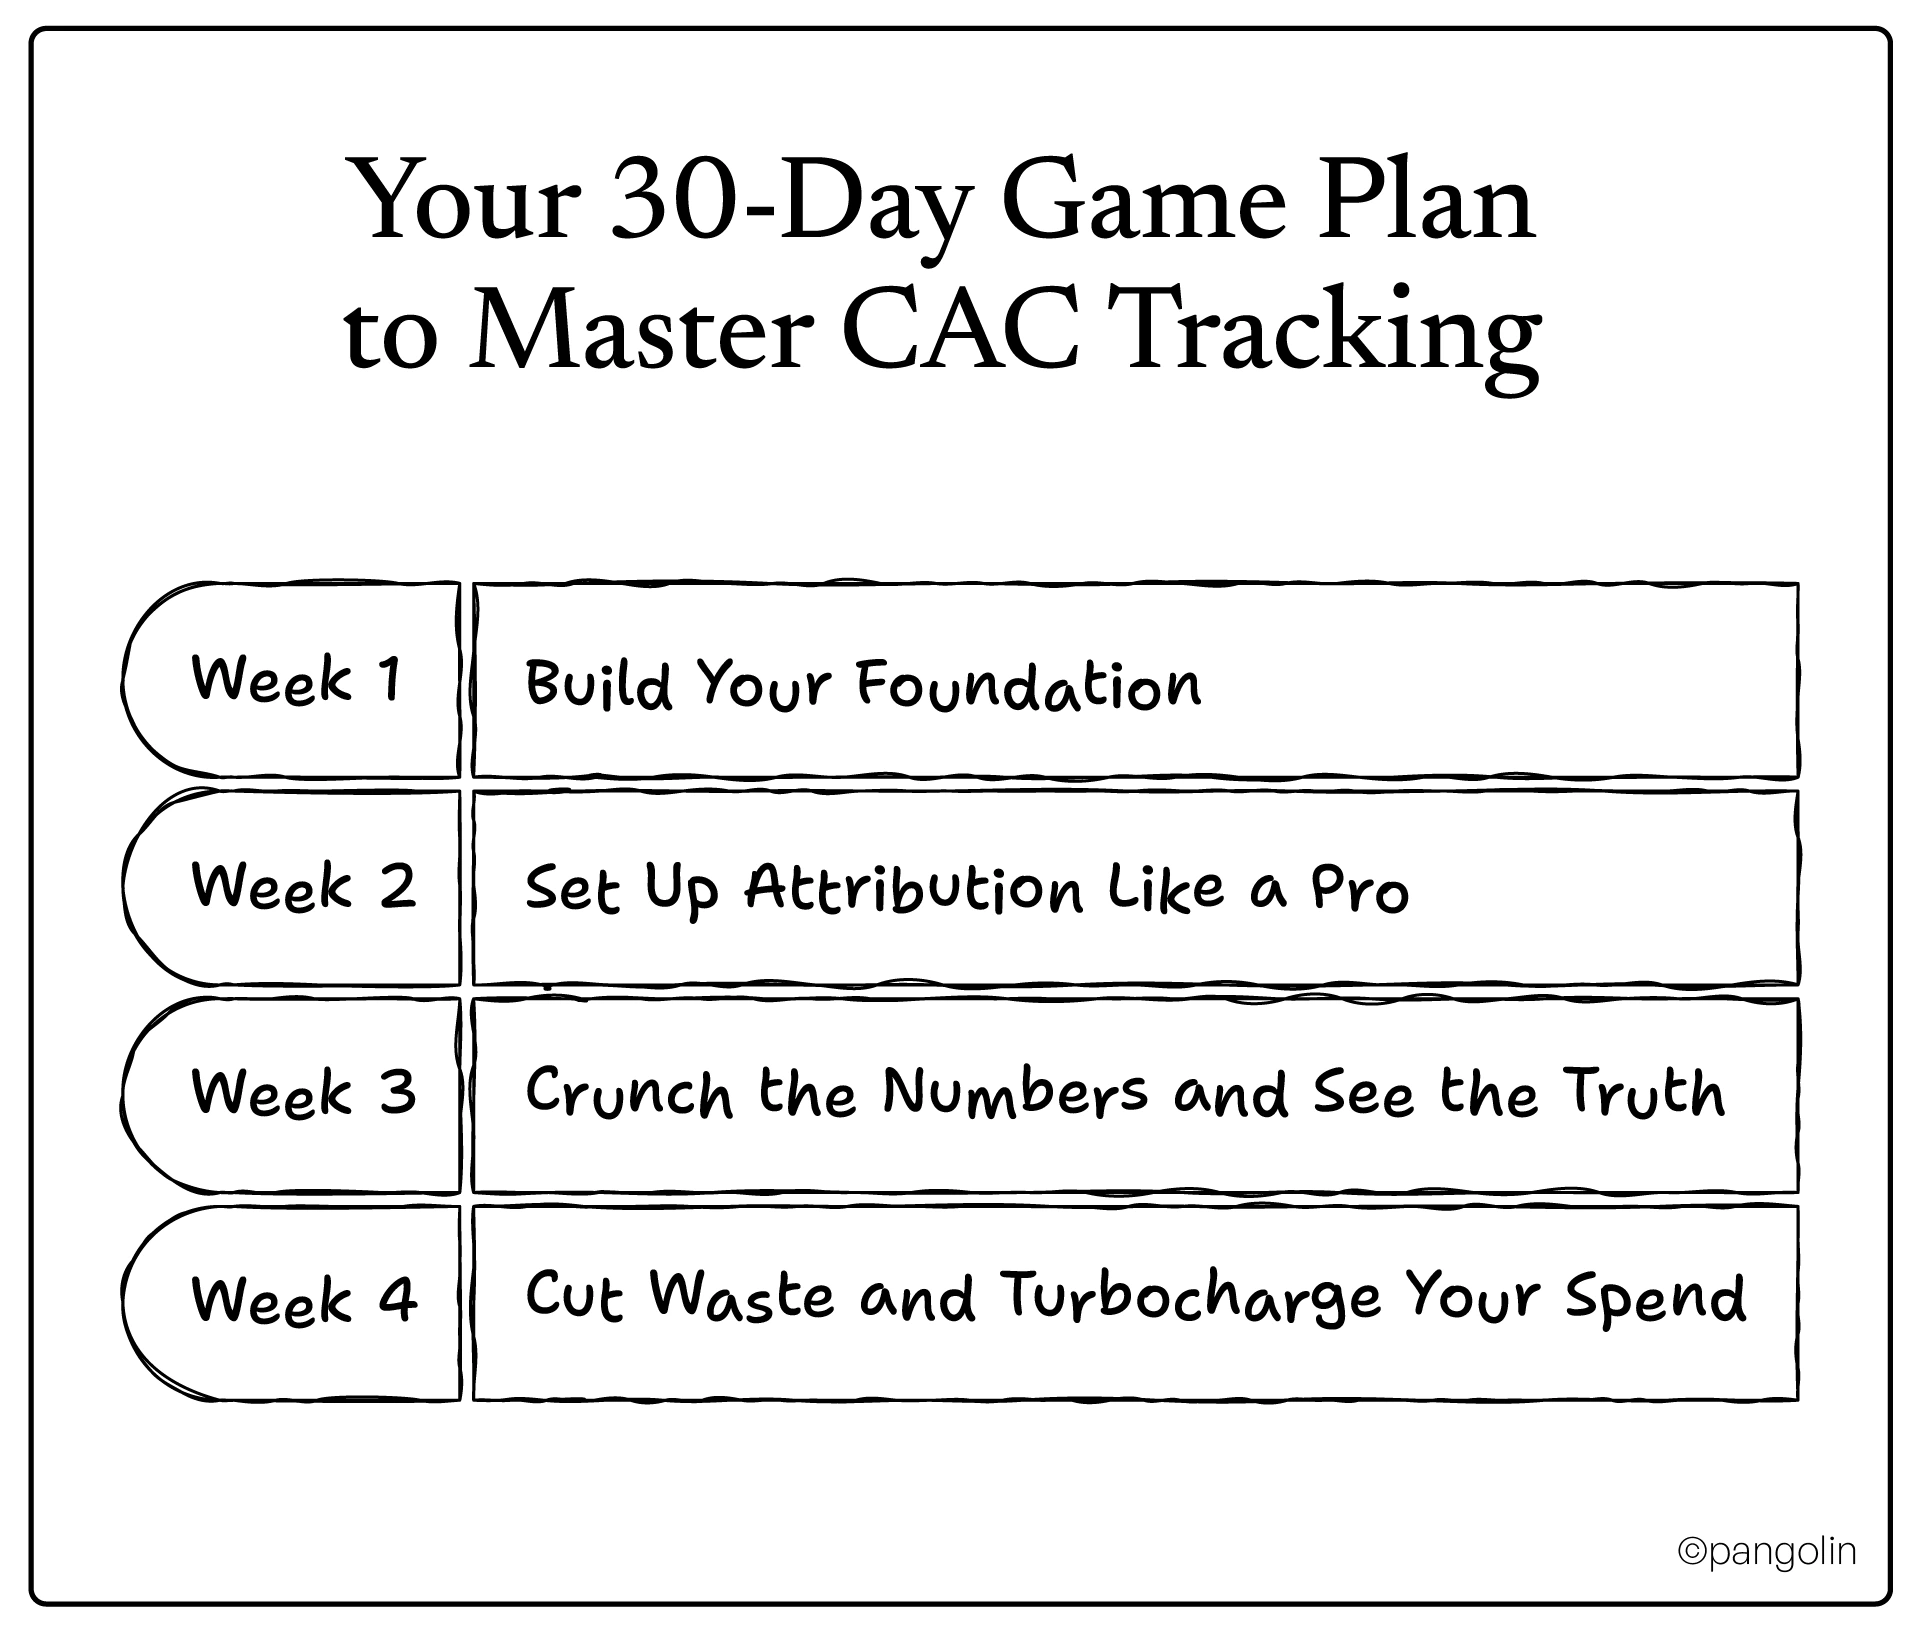
This week is all about getting your house in order. You can't build a skyscraper on a shaky foundation.
Now that your foundation is solid, it's time to build the framework that will give you real insights.
This is the week the magic happens. You’ll finally see the real numbers behind your marketing efforts.
With clear data in hand, this is the week you turn insights into action and start seeing a real return.
Bonus: Grab our handy 30-Day CAC Implementation Checklist to keep you on track, with pro tips and tool suggestions for every step.
Imagine walking into your next meeting and never having to say "I think this channel is working" again. Instead, you can say, "I know this channel works, and here's the data to prove it."
This is what happens when you get your CAC tracking right. You stop explaining why marketing "doesn't work" to your CEO and start showing them how it drives revenue. You'll have the clean, compelling proof of your marketing ROI that shows how you can:
But here’s the hard truth: while you're reading this, your competitors are already optimizing their acquisition costs, scaling faster, and closing deals more predictably. Right now, they have a clearer picture of their business than you do.
Ready to stop flying blind and fix your attribution nightmare?
We're offering a free, 15-minute CAC audit where we'll give you personalized recommendations tailored to your unique business. No fluff, no sales pitch, just actionable advice.
Don’t wait for the next surprise board meeting. Book your free 15-minute call today and finally take control of your CAC, your budget, and your company’s growth.
CAC is the total cost your business spends to acquire a single new customer. It’s calculated by dividing all your sales and marketing expenses over a specific period by the number of new customers you gained in that same period.
For an accurate picture in B2B IT, you need to go beyond just ad spend. Your calculation should include marketing team salaries, sales team salaries and commissions, the cost of your tech stack (CRM, automation tools), and any expenses related to onboarding and support.
A healthy LTV (Lifetime Value) to CAC ratio is your key to sustainable growth. You should aim for a ratio of at least 3:1, meaning a customer generates at least three times the revenue of what it cost to acquire them. A ratio of 5:1 or higher is considered excellent.
To lower your CAC, start by optimizing your marketing channels, double down on what works and cut what doesn't. Improve your conversion rates through A/B testing, enhance your customer targeting, and leverage marketing automation to improve efficiency. Investing in high-quality content marketing can also lower CAC over the long term.
The long sales cycles in IT (often 60-90+ days) mean that monthly CAC calculations can be very misleading. A lead acquired in January might not become a customer until April. To account for this, use rolling 3- or 6-month averages to get a more accurate and stable view of your true CAC.
Multi-touch attribution gives credit to all the marketing touchpoints that influenced a customer's decision, not just the final click. In IT, where a buyer might interact with a blog post, a webinar, and a sales call over several months, this model gives you a far more accurate picture of which channels are actually working, allowing you to invest your budget more effectively and lower your CAC.
The three biggest mistakes are:
AI gives you a serious competitive edge. It can analyze vast amounts of data to predict which leads are most likely to convert, allowing your sales team to focus on the hottest prospects. It can also automate complex attribution modeling, giving you a crystal-clear view of your entire funnel. On average, companies using AI for marketing optimization see a 37% reduction in CAC.

