7 Steps for IT Services Marketing Budget Success

Kavya Somani
December 17, 2025
Table of Contents
Tags
Conversion Optimization
Industry
B2B Tech
B2B Services

TL;DR

  • Marketing budgets for IT services average 8-9% of revenue; growth-stage companies often need 15-30%.​
  • Full-funnel allocation works best: awareness (30%), consideration (35%), conversion (30%), analytics/tools (5%).​
  • Email, SEO, and content marketing drive the highest ROI in B2B IT—master these before expanding to other channels.​
  • Cost per lead for IT services is high ($501 on average), so focus on quality over quantity and track actual business impact.​
  • Start with goals, work backward from sales targets, and tie every dollar to revenue contribution.​
  • Flexible budgets win—plan for quarterly reviews and reserve 10-20% for experiments and market changes.​
  • Prove ROI with pipeline metrics, revenue attribution, and clear data—this is what gets budgets approved by CFOs.​
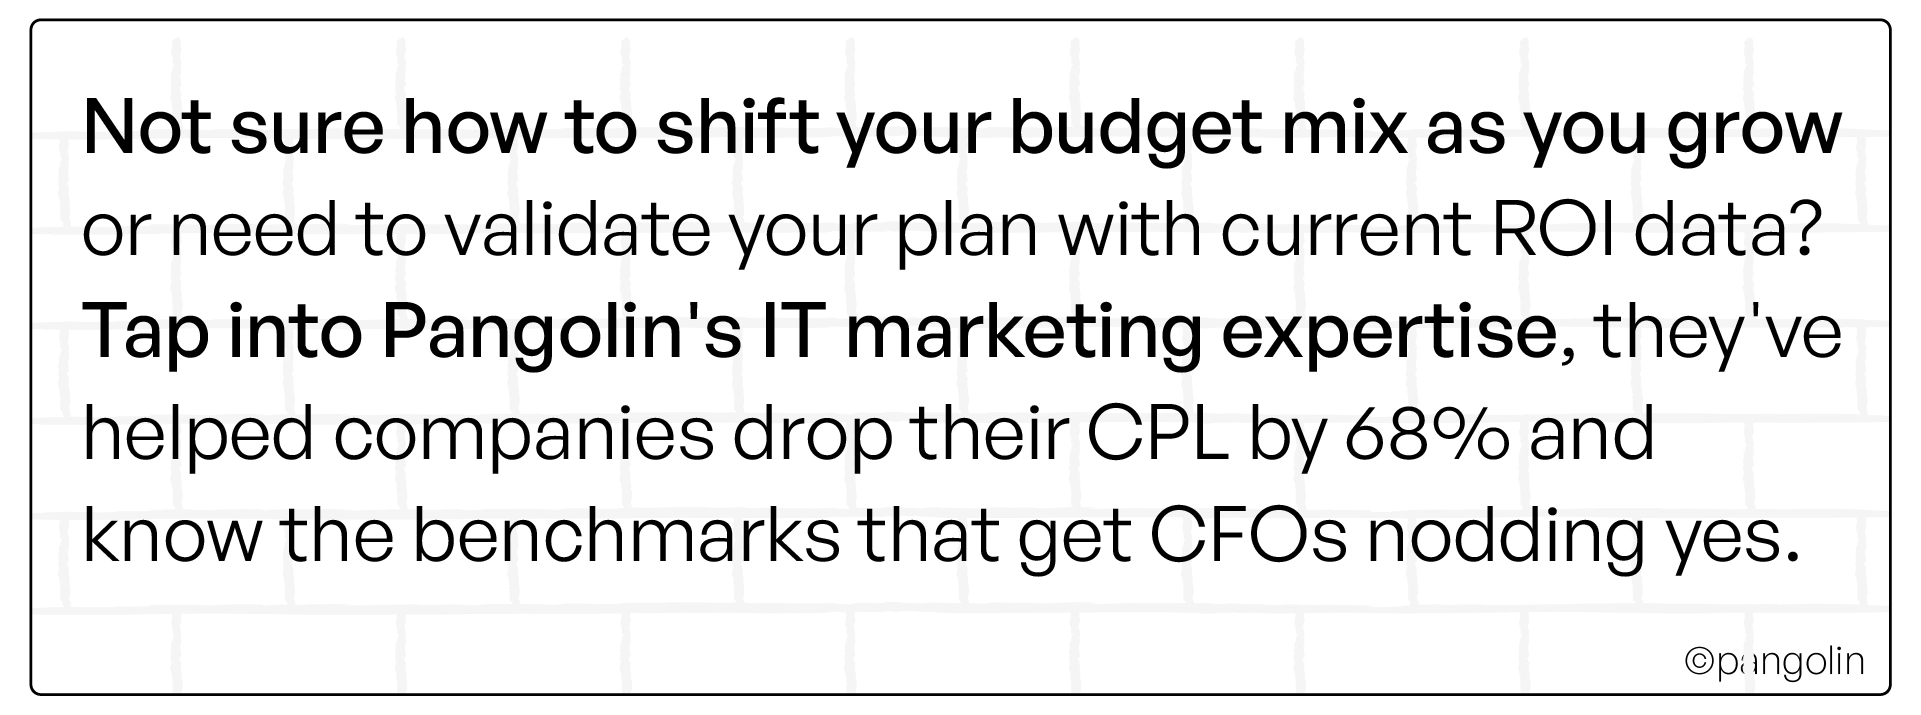
  • Pangolin's IT budgeting frameworks have dropped CPL by 68% for clients and can help structure your plan for approval.

Budgeting for IT Services Marketing Campaigns: The CFO-Proof Guide

In 2016, two Texas entrepreneurs, Riad Bekhit and Alex Craig, launched a service letting people mail custom messages written on actual potatoes. Yes, potatoes.

They called it Potato Parcel, and the internet lost its mind. Appeared on Shark Tank. Secured Kevin O'Leary's investment. Shipped over 70,000 potatoes. Hit $700,000 in annual revenue.

Here's what's crazy: they knew exactly how much each potato cost to source, ship, and personalize. They calculated customer acquisition costs down to the cent. They tracked ROI on every marketing channel. A joke business built on root vegetables had more financial rigor than most IT services companies.

Meanwhile, 59% of IT marketing leaders say they don't have enough budget to execute their strategy. They're managing multi-million-dollar companies but can't prove marketing ROI to skeptical CFOs. Budget proposals get rejected because they lack the data backing that a potato business nailed on day one.

If a company mailing customized potatoes can master marketing budgeting, so can you.

This guide shows you how with exact benchmarks, channel allocations, and the frameworks to get your budget approved by even the toughest CFO.

[[divider]]

The Budget Reality: Why Most IT Marketing Leaders Are Under-Resourced

Let's start with the numbers that explain why you're here.

59% of CMOs don't have enough budget to execute their strategy. Not "would like more", don't have enough. Marketing budgets have flatlined at 7.7% of revenue (down from 9.1% peak), while expectations keep climbing.

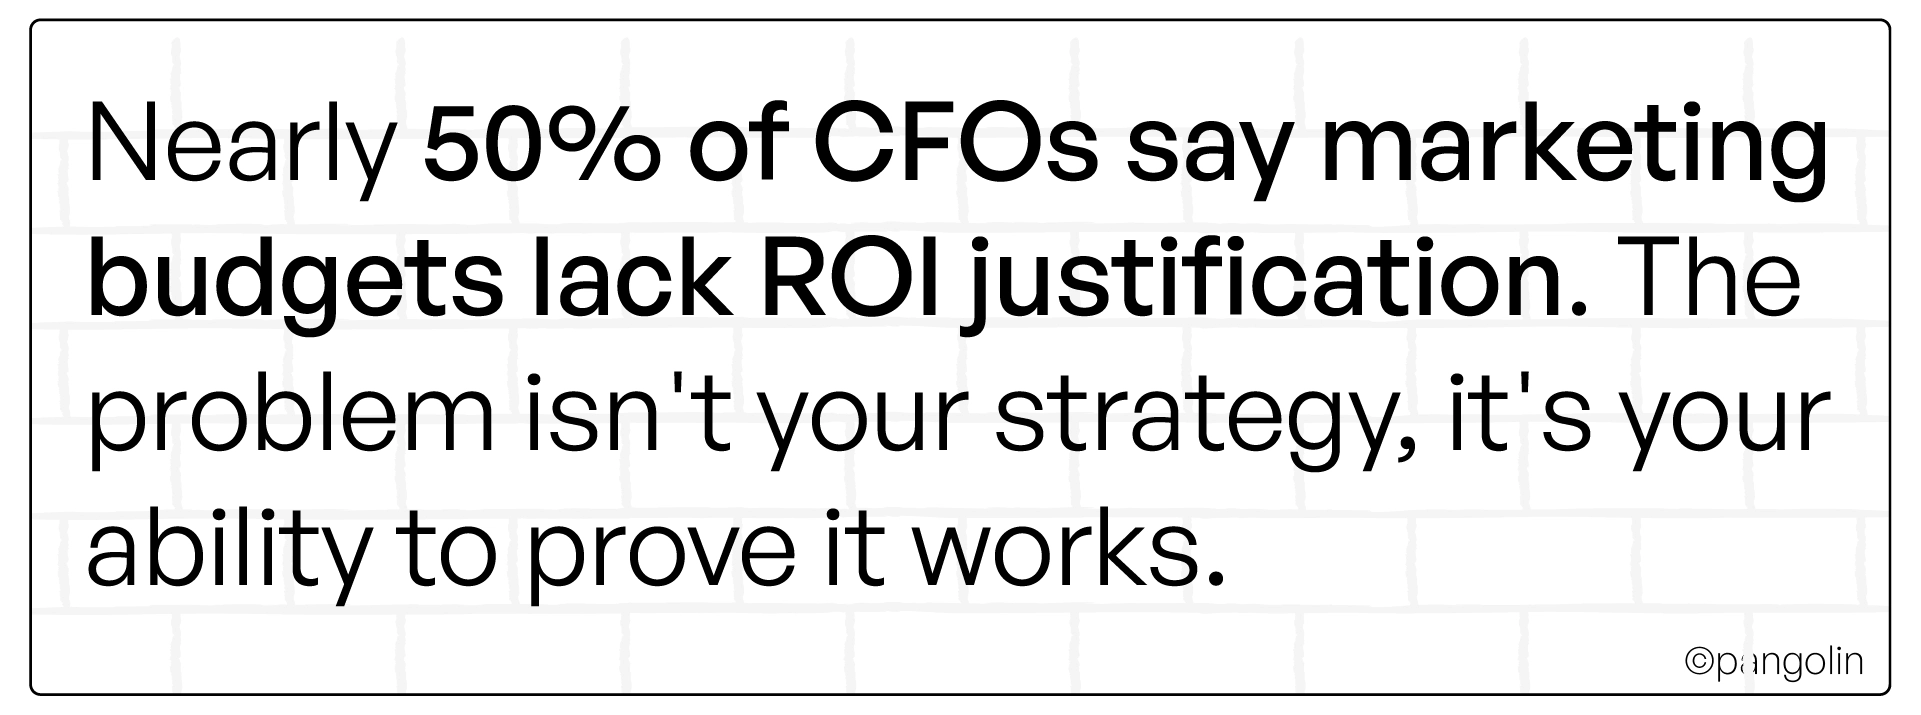
Only 23% of CEOs believe marketing delivers measurable ROI. Think about that. Three-quarters of your leadership team are skeptical that your budget generates value.

64% of marketing leaders can't track the financial impact of their activities. Attribution is a nightmare. Sales cycles span 6-8 months. Multiple stakeholders complicate tracking. You know marketing works, but proving it? Different story.

51% of B2B marketing leaders must rationalize budgets monthly. Not annually. Not quarterly. Monthly defense of every dollar.

The result? Marketing becomes a cost center to minimize instead of a growth driver to invest in. You're stuck justifying spend rather than optimizing for results.

Text graphic stating ‘Nearly 50% of CFOs say marketing budgets lack ROI justification. The problem isn’t your strategy, it’s your ability to prove it works.’

This guide fixes that.

[[divider]]

What You Should Actually Spend (Industry Benchmarks That Matter)

Stop guessing. Here's what IT companies actually allocate to marketing.

By Industry Average

  • B2B Services Overall: 7.7-9.4% of revenue
  • IT/Managed Services: 8.5-8.7%
  • Tech Software/SaaS: 9.16%
  • Marketing Budget Increase 2025: Up to 9.4% (from 7.7% in 2024)

By Company Stage

The startup-to-mature spectrum changes everything:

  • Early-Stage (Startup): 40-50% of revenue—aggressive acquisition mode
  • Growth Stage: 20-30%—scaling proven channels
  • Mature/Established: 15-25%—optimizing efficiency
  • Very Mature: 8-12%—maintaining market position

Reality Check

These aren't rules. They're starting points. Your actual budget depends on:

  • Growth targets: Conservative 10% growth needs different budget than aggressive 3X target
  • Market maturity: Established category vs. creating new market
  • Sales cycle length: 6-8 months for IT services requires extended nurturing investment
  • Competitive intensity: Crowded markets demand more differentiation spend pangolin marketing​

The formula: Start with industry average for your stage, then adjust based on goals and constraints.

[[divider]]

Where to Allocate: The Channel-by-Channel ROI Breakdown

Budget without strategy is waste. Here's where every dollar should go, backed by ROI data.

Funnel Stage Budget % Focus
Top of Funnel (Awareness) 25-35% SEO, content, social, PR, brand ads
Middle of Funnel (Consideration) 30-40% Email nurturing, webinars, case studies, retargeting
Bottom of Funnel (Conversion) 25-35% Demos, trials, sales enablement, ABM
Operations & Analytics 10% Tools, automation, attribution, CRM

Why this matters: IT buyers need 28.87 touchpoints over 6-8 months. Skip a funnel stage, and you create leaks that waste the rest of your budget.

[[divider]]

Channel Allocation by ROI (Where Winners Put Money)

Tier 1: Highest ROI (40-50% of Total Budget)

Email Marketing

  • ROI: 3,600% (36:1 return)
  • Budget: $30K-45K annually
  • Why: Cheapest customer retention and nurturing channel. Period.

SEO & Organic Content

  • ROI: 2,200% (22:1 return)
  • Budget: $130K-180K annually depending on stage
  • Why: Compounds over time. Every dollar spent today works for years.

Content Marketing

  • ROI: Highest for B2B overall
  • Budget: 15-20% of total marketing budget
  • Why: Feeds SEO, email, social, sales enablement. Multi-purpose asset.

Tier 2: Moderate ROI (30-35% of Budget)

Webinars

  • ROI: 364%
  • Why: Major lead generation for IT: buyers want education, not pitches.

LinkedIn Organic

  • ROI: 229%
  • Why: B2B buyers live here. Cost-effective awareness building.

LinkedIn Ads

  • Budget: $80K-290K for growth-stage companies
  • Why: Precise targeting. Higher CPL but reaches exact decision-makers.

Tier 3: Strategic Investment (15-20% of Budget)

PPC/Google Ads

  • ROI: 46-94%
  • Budget: $60K-290K depending on goals
  • Why: Lower ROI but immediate results. Useful for testing and demand capture.

Events & Trade Shows

  • CPL: $811 (expensive)
  • Budget: $35K-55K annually
  • Why: Strategic networking, not volume lead gen.

PR & Media

  • Budget: $80K-180K for high-growth
  • Why: Builds credibility and thought leadership at scale.

Testing & Contingency: 5-10%

Reserve budget for:

  • New channel experiments
  • Seasonal opportunities
  • Competitive responses
  • Market shifts

Critical insight: Don't spread thin. Master 3-4 channels before expanding. Depth beats breadth in B2B.

[[divider]]

The Numbers That Actually Matter: CPL and ROI Benchmarks

Cost Per Lead by Channel


Channel Average CPL Context
Referrals/Affiliates $25-73 Most cost-effective
Multi-channel prospecting $188 Integrated approach
B2B SaaS average $188 Benchmark
Overall B2B average $198-200 Mid-range
IT Services $501 Higher due to complexity
Software Development $595 Highest technical CPL
Trade Shows/Events $811-840 Most expensive

Why IT costs more: Complex solutions, multiple stakeholders (average 7 people), longer cycles (6-8 months), technical evaluation required.

But higher CPL is a reality. Focus on customer lifetime value, not just acquisition cost.

  • Overall B2B Marketing: 5:1 ($5 return per $1 spent)
  • Email: 36:1
  • SEO: 22:1
  • Marketing Automation: 5.44:1
  • Content Marketing: Top performer for B2B
  • PPC: 1.3-1.5:1 (lower but immediate)

Minimum acceptable: 5:1 ROI. If you're below that, something's broken: wrong channels, poor targeting, weak conversion, or flawed measurement.

[[divider]]

The 7-Step Budget Planning Framework (How to Build Yours)

Forget last year's copy-paste approach. Start fresh.

Step 1: Goals First, Budget Second

Define outcomes before allocating dollars:

  • Pipeline target: $X in marketing-sourced opportunities
  • Lead volume: X MQLs, X SQLs per quarter
  • Revenue contribution: Marketing should influence 30-60% of deals
  • CAC target: What can you afford per customer?

Work backwards from these. Budget follows goals, not tradition.

Step 2: Calculate Available Budget

Formula: Annual Revenue × Budget Percentage = Marketing Budget

Example:

  • $5M revenue company
  • 10% marketing allocation (aggressive growth)
  • = $500K annual marketing budget
  • = ~$42K per month

Factor in:

  • Revenue projections (not last year's actual)
  • Growth stage requirements
  • Funding availability

Step 3: Map to Full Funnel

Don't skip stages. IT buyers need 28.87 touchpoints over 6-8 months.

Allocation:

  • 30% awareness (educate early in research)
  • 35% consideration (nurture through evaluation)
  • 30% conversion (close ready buyers)
  • 5% retention/advocacy

Missing any stage = leaky bucket that wastes the rest.

Step 4: Prioritize by ROI

Invest heavily in proven winners:

  • Email (36:1 ROI)
  • SEO (22:1 ROI)
  • Content (best for B2B)

Keep 10% for testing new channels, but 90% goes to what works.

Step 5: Account for IT-Specific Realities

Generic B2B benchmarks miss these:

  • Long sales cycles (6-8 months) = higher nurturing costs
  • Multiple stakeholders (7 people average) = more content variety needed
  • Technical complexity = education-heavy content budget
  • Commoditization pressure = differentiation investment required

Budget for marathons, not sprints.

Step 6: Build in Flexibility

Lock 80-85% of budget into proven programs. Keep 15-20% flexible for:

  • Quarterly performance shifts
  • Market opportunities
  • Competitive responses

Review quarterly. Shift budget to winners, cut losers.

Step 7: Align with Sales Targets

Every dollar should tie to the pipeline.

Example calculation:

  • Sales needs 100 SQLs/quarter to hit target
  • You convert MQLs to SQLs at 40%
  • You need 250 MQLs/quarter
  • At $501 CPL for IT services
  • Budget required: $125K/quarter minimum

Work backwards from sales needs. This is how you justify budget to CFOs.

[[divider]]

Three Real Budget Models (Copy These)

Model 1: High-Growth Startup ($800K/year)

Category Annual %
SEO & Content $140K 18%
PPC/Paid Ads $290K 36%
PR & Thought Leadership $180K 23%
Email & Automation $45K 6%
LinkedIn Ads $85K 11%
Events & Webinars $40K 5%
Tools & Tech $20K 3%

Strategy: Aggressive acquisition. Building brand from scratch. Heavy paid channels.

Model 2: Moderate Growth ($590K/year)

Category Annual %
SEO & Content $130K 22%
PPC/Paid Ads $120K 20%
PR & Thought Leadership $80K 14%
Email & Automation $85K 14%
LinkedIn Ads $95K 16%
Events & Webinars $55K 9%
Tools & Tech $25K 4%

Strategy: Balanced approach. Scaling proven channels. More email nurturing.

Model 3: Mature/Stable ($470K/year)

Category Annual %
SEO & Content $180K 38%
PPC/Paid Ads $60K 13%
PR & Thought Leadership $80K 17%
Email & Automation $65K 14%
LinkedIn Organic $35K 7%
Events & Webinars $35K 7%
Tools & Tech $15K 3%

Strategy: Efficiency focus. Doubling down on organic. Cutting paid spend.

Notice the shift: As you mature, budget moves from paid acquisition to owned channels with compounding returns.

[[divider]]

The 10 Budget Mistakes That Burn Money

1. No Goals Before Budgeting

Allocating budget without knowing success metrics.

Fix: Define pipeline targets, lead volumes, revenue contribution first. Then budget to achieve them.

2. Starting with Zero Data

Guessing channel performance instead of using analytics.

Fix: Audit last 12 months. What drove customers? What was real CPL and CAC? Budget from facts.

3. Copy-Pasting Last Year

"Last year plus 10%" compounds past mistakes.

Fix: Zero-based budgeting. Justify every dollar by expected ROI.

4. Ignoring Sales Alignment

Marketing budgets without sales input create wrong volumes or quality.

Fix: Work backwards from sales targets. If they need X deals, calculate required leads.

5. Under-Investing in Winners

Chasing new tactics while neglecting email (36:1 ROI) and SEO (22:1 ROI).

Fix: 90% to proven performers, 10% to experiments.

6. One-Channel Dependency

"We'll just do LinkedIn." But buyers need 28.87 touchpoints.

Fix: Multi-channel orchestration across awareness, consideration, conversion.

7. No Flexibility

Locking entire year's budget rigid.

Fix: Keep 15-20% flexible. Quarterly reviews shift budget to winners.

8. Forgetting Long Sales Cycles

Expecting 30-day results when your cycle is 6-8 months.

Fix: Budget for sustained nurturing. ROI appears later but compounds.

9. Vanity Over Revenue

Celebrating traffic and followers instead of pipeline.

Fix: Track marketing-sourced revenue, MQL-to-SQL conversion, CAC.

10. No Testing Budget

Every dollar allocated, no room for opportunities.

Fix: Reserve 5-10% for testing, market responses, seasonal opportunities.

[[divider]]

How to Prove ROI to Your CFO

This is the section that gets your budget approved.

Tier 1: Revenue Impact (What CFOs Care About)

  • Marketing-sourced pipeline (target: 30-60% of sales pipeline)
  • Marketing-influenced deals
  • Customer Acquisition Cost (CAC)
  • Customer Lifetime Value (CLV)

Tier 2: Pipeline Metrics (What You Manage Daily)

  • MQLs generated
  • MQL-to-SQL conversion rate (benchmark: 50%+)
  • SQL-to-customer rate
  • Cost per lead by channel

Tier 3: Leading Indicators (What Predicts Future Results)

  • Content engagement
  • Email performance
  • Website traffic from ICP companies
  • Social engagement from target accounts

[[divider]]

The ROI Formula

(Revenue from Marketing - Marketing Cost) ÷ Marketing Cost × 100

Target: Minimum 5:1 ROI ($5 return per $1 spent). Top performers achieve 10:1+.

Report monthly: Show pipeline contribution, not activity metrics. Leadership cares about revenue, not clicks.

[[divider]]

What to Present to Get Approval

1. Historical Performance

  • Last 12 months: What worked, what didn't
  • Channel-by-channel ROI data
  • Marketing-sourced vs. sales-sourced deals

2. Gap Analysis

  • Sales target: $X revenue needed
  • Current pipeline: $Y in opportunities
  • Gap: $Z shortfall
  • Marketing's role: Generate $Z through specific channels

3. Proposed Investment

  • Exact channel allocations with rationale
  • Expected ROI per channel (cite benchmarks)
  • Timeline to results (be realistic about 6-8 month cycles)

4. Risk Mitigation

  • "If we don't invest": Show competitive threats, market share loss
  • "If we invest wrong": Explain quarterly reviews and reallocation flexibility
  • "How we track": Three-tier measurement framework

5. The Ask

  • Specific dollar amount
  • Connected directly to revenue target
  • Broken down by funnel stage and channel

CFO language: Speak ROI, CAC, LTV, payback period. Not engagement, awareness, or reach.

[[divider]]

Quick-Start Budget Calculator

Step 1: Total Budget

Annual Revenue × Budget % = Total Marketing Budget

Example: $5M × 10% = $500K

Step 2: Funnel Allocation

  • Top (Awareness): $150K (30%)
  • Middle (Consideration): $175K (35%)
  • Bottom (Conversion): $150K (30%)
  • Analytics/Tools: $25K (5%)

Step 3: Channel Assignment

  • Email: $45K (highest ROI)
  • SEO: $130K (high ROI, long-term)
  • Content: $75K (supports all stages)
  • LinkedIn: $90K (B2B essential)
  • PPC: $70K (immediate results)
  • Events: $45K (strategic networking)
  • Tools: $25K (automation)
  • Testing: $20K (10% flexible)

Adjust based on:

  • Your company stage
  • Growth targets
  • Market conditions

Text graphic inviting readers to tap into Pangolin’s IT marketing expertise to shift budget mix, validate ROI, lower cost per lead by 68%, and meet CFO expectations.

[[divider]]

Budget Follows Strategy, Not the Reverse

Here's the truth: your budget shouldn't dictate your strategy. Your strategy should justify your budget.

59% of CMOs are under-resourced. Use this framework to prove why you need what you need:

  1. Show the pipeline gap
  2. Calculate required lead volume
  3. Demonstrate channel ROI with industry data
  4. Connect budget directly to revenue targets

The opportunity is massive:

  • Average B2B marketing delivers 5:1 ROI
  • Email delivers 36:1
  • SEO delivers 22:1
  • Pangolin Marketing clients see 68% lower CPL, 28% lower CAC, 122% conversion lift

Your action plan:

  1. This week: Audit last 12 months' performance
  2. Next week: Build budget using 7-step framework
  3. Week 3: Present to CFO with ROI projections
  4. Week 4: Launch optimized budget allocation

Budget based on data, not tradition. Your CFO will respect it. Your pipeline will reflect it.

Need help building your IT services marketing budget? Pangolin has helped clients achieve 68% drops in CPL and 28% lower CAC through data-driven budget optimization. Let's talk about yours.

FAQs

1. What % of revenue should IT firms spend on marketing?
2. What channels offer the highest ROI in B2B IT?
3. How should I split my marketing budget across the funnel?
4. What's a good cost per lead (CPL) for IT services?
5. How do I prove marketing ROI to my CFO?
6. How often should I review or adjust my budget?
7. Can I use last year's budget as a template?
Tags
Conversion Optimization
Industry
B2B Tech
B2B Services