IT services companies average 25% lead-to-MQL conversion (below 31% industry average) due to multi-stakeholder complexity, not marketing incompetence
The six conversion killers: weak lead qualification, missing credibility proof, form friction, slow page speed, generic landing pages, and poor sales follow-up
Create role-based landing pages for IT Directors (security focus), CFOs (ROI focus), VP Ops (implementation focus), and C-Suite (strategic focus) to increase conversion 35-60%
Reduce form fields from 8 to 4 and improve completion rates by 30-50%; use progressive profiling for additional data collection
Case studies with quantified outcomes improve demo request conversion by 25-40%; IT buyers won't engage without proof points
Pages loading >4 seconds see 30%+ conversion drop; optimize to <2.5 seconds for immediate 15-25% lift
Implement weighted lead scoring (MQL: 40+ points, SQL: 70+ points) to improve sales productivity by 30-40%
Create formal Lead SLA between sales and marketing defining MQL/SQL criteria, 1-hour response time, and shared KPIs to improve funnel conversion 25-35%
Top-performing IT services companies achieve 40%+ lead-to-MQL and 5-7% website-to-lead conversion rates vs. industry averages of 25% and 2-4%
Optimizing conversion from 25% to 35% MQL and 20% to 28% SQL yields 40%+ more closed deals from same lead volume, no additional ad spend needed
In August 2015, Leicester City entered the English Premier League season with 5,000-to-1 odds of winning the title. Bookmakers gave the same odds for Elvis being found alive.
Most teams had bigger budgets. Bigger stars. Better facilities.
But by May 2016, Leicester City were champions. They finished 10 points ahead of Arsenal, 11 ahead of Tottenham, and 31 points ahead of the previous season's champions, Chelsea.
Everyone called it a miracle. But here's what actually happened.
Leicester didn't have more possession (just 42.4%, league's lowest among top teams).
What they did is they optimized their system. Your IT services company is sitting on a similar opportunity right now.
You're generating leads. But 79% of them never convert to sales. Industry average lead-to-MQL conversion is 31%. IT services companies? Just 25%.
That's not a talent problem. It's not a budget problem. It's a system problem.
The companies that fix the system, building role-based targeting, implementing lead scoring, optimizing landing pages, and aligning sales-marketing, win 40%+ more deals from the same lead volume.
This isn't about working harder. It's about working smarter by fixing what's actually broken.
Why IT Services Lead Gen Fails Where Other Industries Succeed
Your IT services company generates leads. They hit sales' inbox. Then... silence.
Here's the truth: Your leads aren't broken. Your system is.
The IT Services Buyer Journey Is Uniquely Complex
Unlike B2B SaaS (3-4 month cycles, 2-3 decision-makers) or Legal Services (1-2 months, 1-2 decision-makers), IT services face:
7-10 month sales cycles
4-7 decision-makers in every deal
RFP/RFQ processes taking 2-4 weeks minimum
Mandatory security audits and compliance checks
Pilot programs before final commitment
Each stakeholder has conflicting priorities:
IT Director worries about integration, security, scalability
CFO worries about ROI, TCO, licensing flexibility
VP of Operations worries about implementation disruption, downtime
C-Suite worries about strategic competitive advantage
And here's the kicker: 60% of the buying process happens before any vendor contact.
Prospects evaluate 3-5 competitors independently. They research case studies, check references, read reviews. By the time they contact you, they've already eliminated half the vendors.
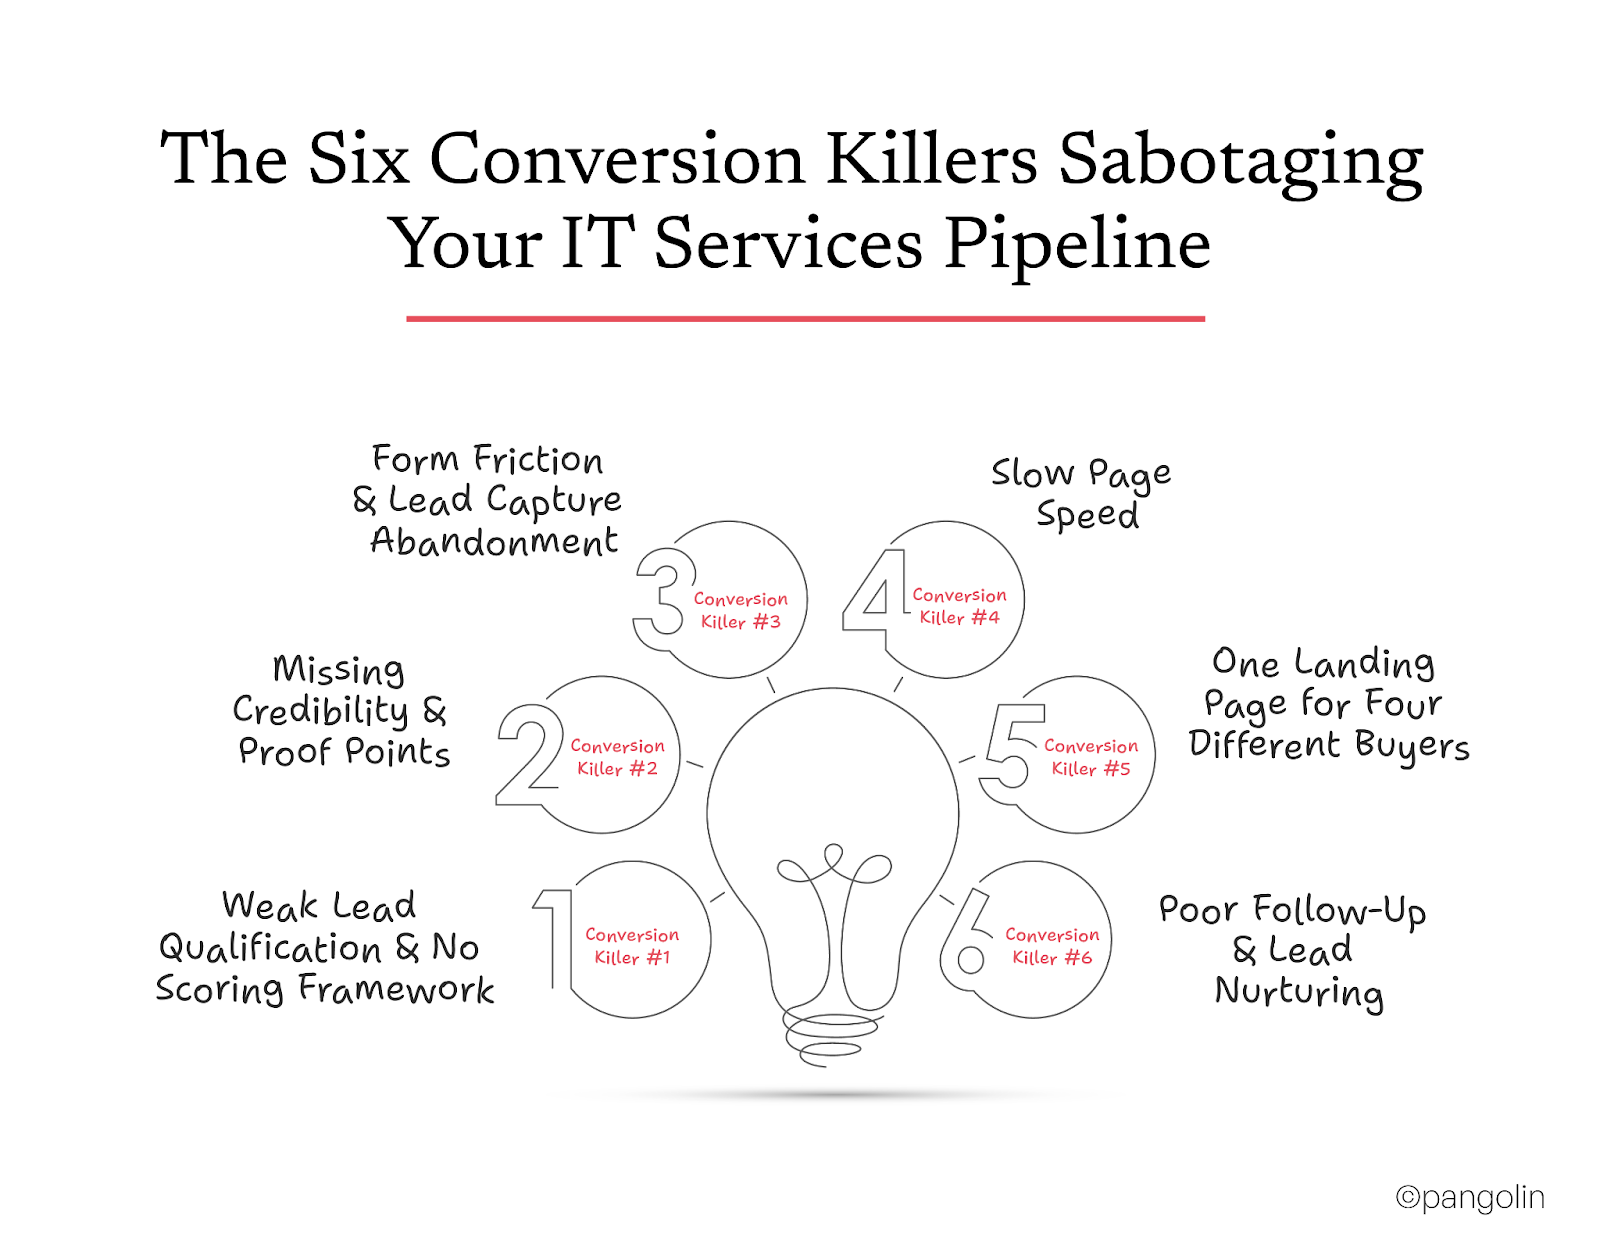
The Six Conversion Killers Sabotaging Your IT Services Pipeline
Most IT services marketing teams know something is broken. They just don't know exactly what.
Here are the six bottlenecks killing your conversion rates, and why they're costing you 40-60% of your pipeline.
Conversion Killer #1: Weak Lead Qualification & No Scoring Framework
The Problem:
79% of generated leads never convert to purchase
Your sales team rejects 50% of marketing leads as "unqualified"
Marketing and sales define "qualified" differently
You're attracting information gatherers (researchers, not decision-makers)
Why It Happens: You don't have a formal ICP (Ideal Customer Profile) or lead scoring system. Every lead gets treated equally. Sales chases prospects who will never buy while real buyers go cold.
The Cost: Sales wastes 50% of their time on unqualified prospects. Real opportunities fall through the cracks.
IT buyers won't take meetings without proof of success
Generic "We deliver IT solutions" messaging doesn't differentiate
You lack case studies showing similar company sizes, industries, outcomes
Security certifications and compliance achievements buried or missing
Why It Happens: You're focused on feature messaging ("We offer 24/7 support") instead of credibility-first positioning ("Here's how we migrated 500 employees to cloud in 60 days with zero downtime").
The Cost: Demo request conversion drops 40%+ without strong proof points.
Conversion Killer #3: Form Friction & Lead Capture Abandonment
The Problem:
Forms with 8+ fields have 50%+ abandonment rate
Each additional field after 3 reduces conversion by 2-5%
Mobile forms have 2x higher abandonment than desktop
No progress indicators on multi-step forms confuse users
Why It Happens: You're asking for budget, timeline, company size, pain points, and decision-making authority upfront. Prospects see the form and bounce.
The Cost: For every 10 potential leads, you lose 5 at form submission.
Conversion Killer #4: Slow Page Speed
The Problem:
Pages loading >4 seconds see 30%+ conversion drop
Each 0.1s delay costs 8-10% in services conversion
IT buyers are impatient; slow pages signal poor technical competence
Why It Happens: Unoptimized images, bloated JavaScript, no CDN, slow server response times.
The Cost: Agrofy reduced abandonment from 3.8% to 0.9% just by optimizing page speed. That's a 76% improvement from technical optimization alone.
Conversion Killer #5: One Landing Page for Four Different Buyers
The Problem:
Your landing page speaks to "IT decision-makers" generically
IT Director needs technical depth; CFO needs ROI proof; VP Ops needs implementation timeline
Single value proposition doesn't work for 4-7 stakeholders with conflicting priorities
Why It Happens: You built one landing page to serve everyone. But IT buyers have different questions, different fears, different success metrics.
The Cost: You're converting the 20% of prospects who happen to match your messaging. The other 80% bounce because they don't see themselves in your content.
Conversion Killer #6: Poor Follow-Up & Lead Nurturing
The Problem:
50%+ of qualified leads never get nurtured
Sales response time >1 hour loses leads to competitors
No multi-channel nurturing (email + LinkedIn + retargeting)
MSPs struggle because sales teams are reactive, not proactive
Why It Happens: No SLA between marketing and sales. No agreed-upon MQL definition. No follow-up cadence. Leads enter the funnel and disappear into a black hole.
The Cost: Leads that could have converted in 90-120 days are abandoned after 7 days because no one followed up systematically.
The Multi-Stakeholder Content Strategy: Stop Trying to Speak to Everyone
Here's where most IT services companies fail: They build one landing page. One value proposition. One CTA.
Then they wonder why conversion rates stay stuck at 2-3%.
The truth? One landing page doesn't serve four different decision-makers.
Netflix didn't try to serve DVD customers and streaming customers with the same product. They separated them, optimized each, then scaled. Your IT services content needs the same approach.
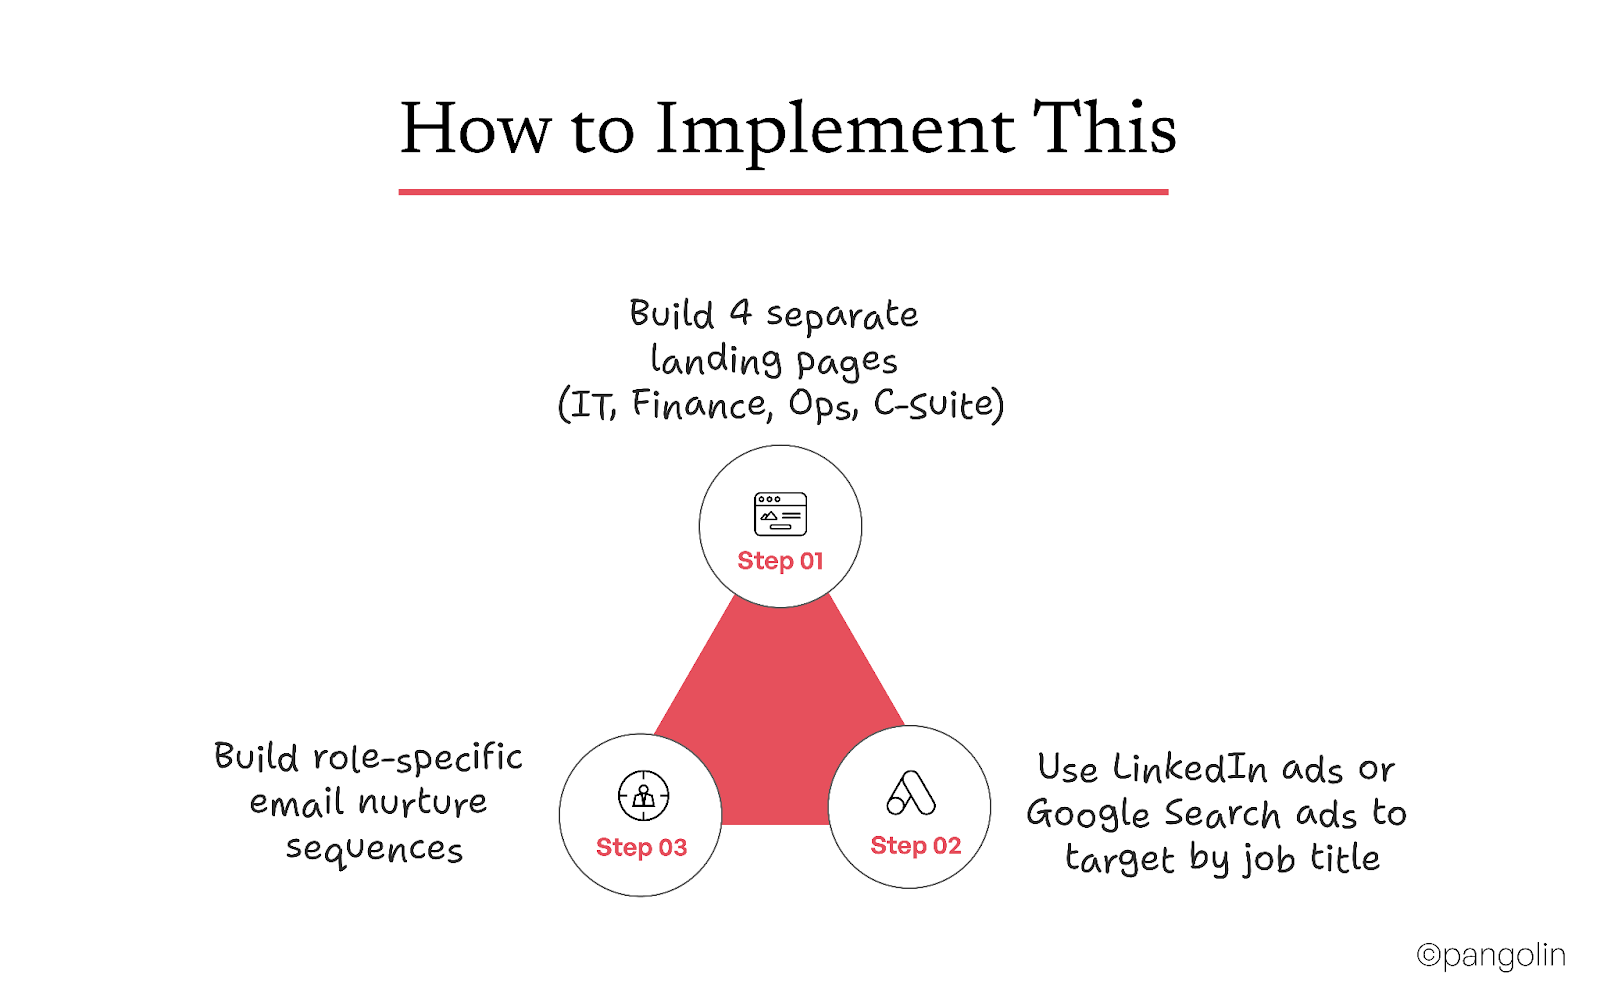
Create Role-Based Landing Pages
Each stakeholder in IT procurement has different priorities, different fears, and different success metrics.
Here's how to speak to each one:
For IT Directors / CTOs
What They Care About:
Integration complexity (will this work with existing systems?)
Security posture (SOC2, ISO 27001, penetration testing)
IT Director sequence emphasizes security, integrations
CFO sequence emphasizes ROI, TCO
Each sequence speaks directly to that role's concerns
Impact: Multi-stakeholder campaigns see 35-60% higher conversion rates compared to generic landing pages.
Frictionless Forms: Why Your 8-Field Form Is Killing Conversions
You spent $5,000 on Google Ads. Traffic is strong. Landing page looks great.
Then prospects hit your form and vanish.
Here's why.
The Data on Form Abandonment
Forms with 8+ fields have 50%+ abandonment rate
Each additional field after 3 reduces conversion by 2-5%
Mobile forms have 2x higher abandonment than desktop
68% of users abandon forms because they're "too long or complicated"
For every 10 potential leads, you're losing 5 at form submission. That's not traffic quality. That's form friction.
What to Ask (and What to Skip)
Ask Upfront:
Company name
Email address
Phone number
Role/Title
(Optional) Company size
Don't Ask Upfront:
Budget range
Decision timeline
Current IT provider
Pain points
Number of employees
Detailed project scope
Why? Because you can get this information later through progressive profiling or during the sales call.
Use Progressive Profiling
After someone downloads your whitepaper (4 fields), send a follow-up email asking:
"What's your biggest IT challenge right now?" (behavioral insight)
"When are you looking to implement?" (timeline)
"What's your estimated budget range?" (qualification)
You're collecting the same data. You're just spreading it across touchpoints instead of asking everything at once.
Design for Mobile
30%+ of IT research happens on mobile. If your form isn't mobile-optimized, you're losing a third of your prospects.
Mobile Form Best Practices:
Single-column layout (no side-by-side fields)
Large touch targets (minimum 44x44 pixels)
Auto-fill enabled for email, phone, company
Real-time validation (show errors as users type)
Progress indicator if multi-step
Reduce Friction Visually
Before Optimization:
[Full Name] _______________
[Company Name] _______________
[Email Address] _______________
[Phone Number] _______________
[Job Title] _______________
[Company Size] [Dropdown]
[Annual Revenue] [Dropdown]
[When are you looking to buy?] [Dropdown]
[Budget Range] [Dropdown]
[Current IT Provider] _______________
[Biggest Challenge] [Text box]
Abandonment Rate: 52%
After Optimization:
text
[Email Address] _______________
[Company Name] _______________
[Phone Number] _______________
[SUBMIT]
Abandonment Rate: 22%
That's a 58% improvement in form completion just by cutting fields.
Proof-Based Authority: Why IT Buyers Need Credibility Before They'll Talk to You
IT services buyers are skeptical. They've been burned before.
They won't take a meeting with you until they've validated three things:
You've solved this problem before
You've solved it for companies like theirs
You can prove measurable results
Without proof, you're dead in the water.
Why Case Studies Matter More in IT Services
73% of B2B marketers cite case studies as their most effective content type
97% of B2B buyers say peer recommendations and case studies are the most reliable source of information
IT buyers need to see similar company size, industry, and complexity before they'll engage
Generic "We helped a client improve efficiency" doesn't cut it. They need specifics.
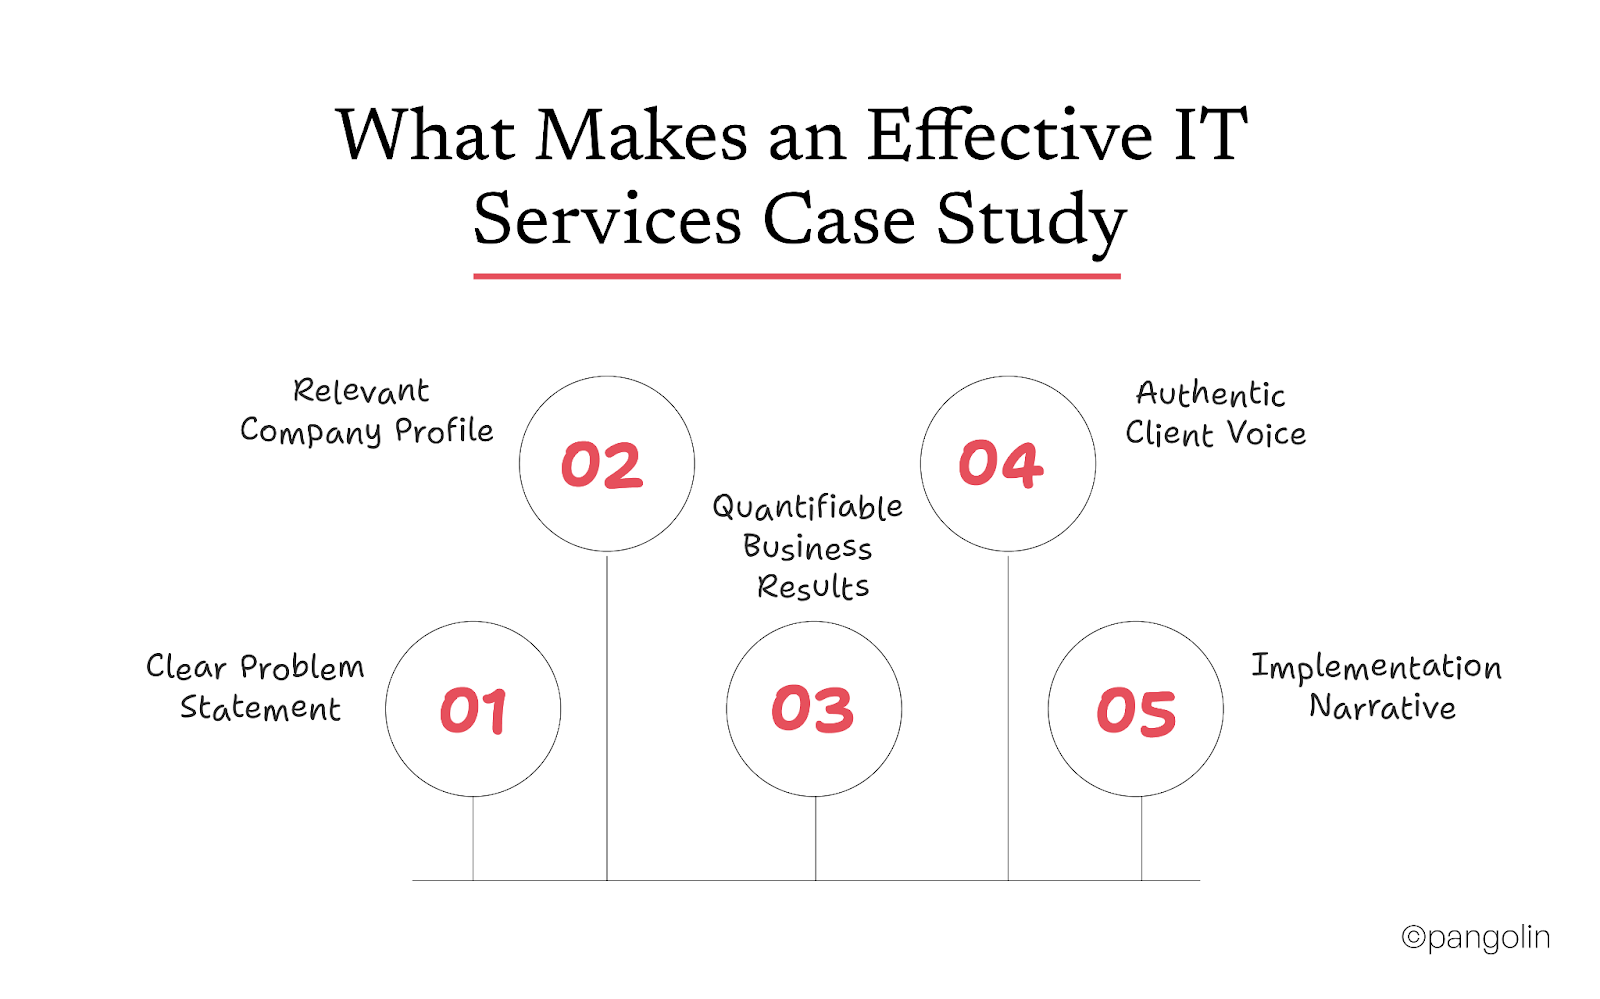
What Makes an Effective IT Services Case Study
1. Clear Problem Statement
Don't: "Company needed IT support." Do: "Manufacturing company with 500 employees faced daily security threats after remote workforce scaling. Legacy VPN couldn't handle load. IT team spent 60% of time firefighting."
2. Relevant Company Profile
Match your prospect's profile:
Industry (manufacturing, finance, healthcare)
Company size (50-500 employees)
IT complexity (size of IT team, infrastructure spend)
3. Quantifiable Business Results
Don't: "Improved security and reduced costs." Do:
30% reduction in IT labor costs ($180K annual savings)
99.99% uptime achieved (vs. 94% before)
SOC2 Type II certification achieved in 60 days
Zero security incidents in 12 months (vs. 8/year before)
4. Authentic Client Voice
Include direct quotes from decision-makers:
IT Director: "We went from firefighting daily issues to strategic planning."
CFO: "ROI was achieved in 14 months, faster than projected."
CEO: "This partnership allowed us to scale 40% without adding IT headcount."
5. Implementation Narrative
Show how you solved it, not just that you did:
Discovery phase: 2 weeks
Migration plan: 4 weeks
Execution: 8 weeks
Training and handoff: 2 weeks
Total: 16 weeks from kickoff to full operation
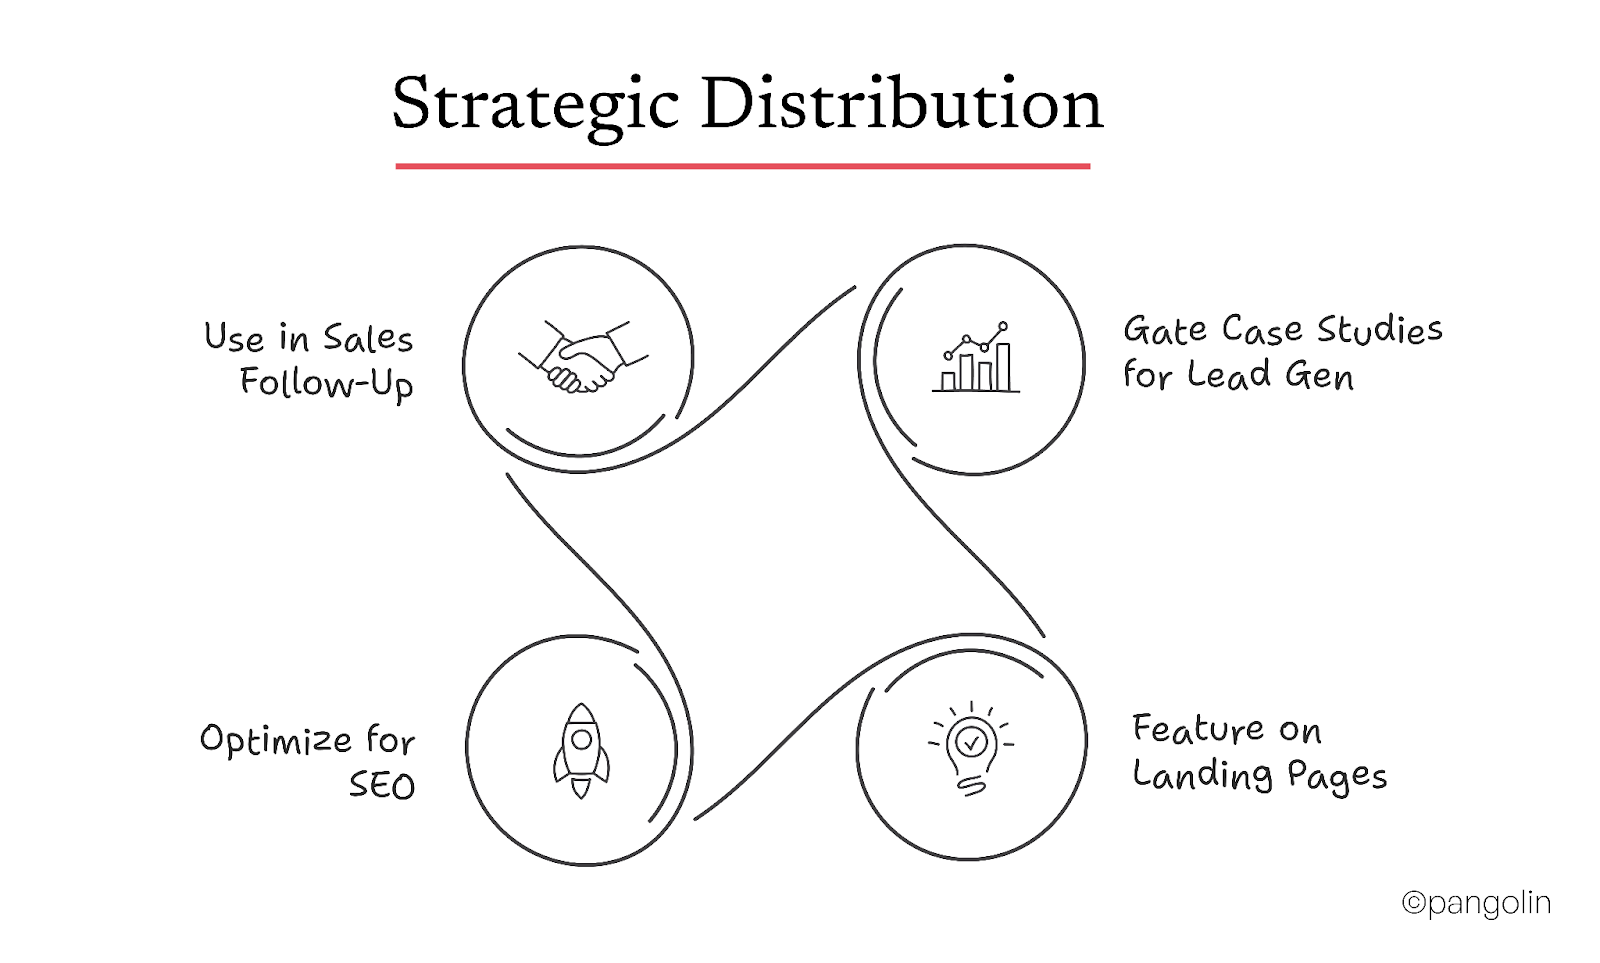
Strategic Distribution
Gate Case Studies for Lead Gen:
Require email + company name to download (2 fields max)
Segment by industry: "Download Manufacturing Case Study"
Track which case studies prospects download (behavioral lead scoring)
Feature on Landing Pages:
Visual case study summaries on product pages
"See How We Helped [Industry] Companies" sections
Customer logo grid with links to full case studies
Use in Sales Follow-Up:
Email sequence: Day 3 → "Here's how we helped a company like yours"
Include relevant case study based on prospect's industry
Personalize: "I noticed you're in manufacturing. Here's a case study from another 400-person manufacturing firm."
Optimize for SEO:
Target keywords: "[Industry] IT services case study," "[Problem] managed services success story"
High-intent organic traffic from prospects researching solutions
Page Speed Optimization: Your Landing Page Loads Like a Dinosaur
You're spending $10K/month on ads. Traffic is good. But conversion rates are stuck.
Here's what you're missing: Your landing page is too slow.
The Data on Speed and Conversion
Pages loading >4 seconds see 30%+ conversion drop
Each 0.1s delay costs 8-10% in services conversion
53% of mobile users abandon pages that take >3 seconds to load
Agrofy reduced abandonment from 3.8% to 0.9% by optimizing Core Web Vitals
That's a 76% improvement from page speed optimization alone.
IT buyers are impatient. If your page takes 6 seconds to load, they're gone. And worse: slow page speed signals poor technical competence. "If they can't optimize their own site, how will they manage my infrastructure?"
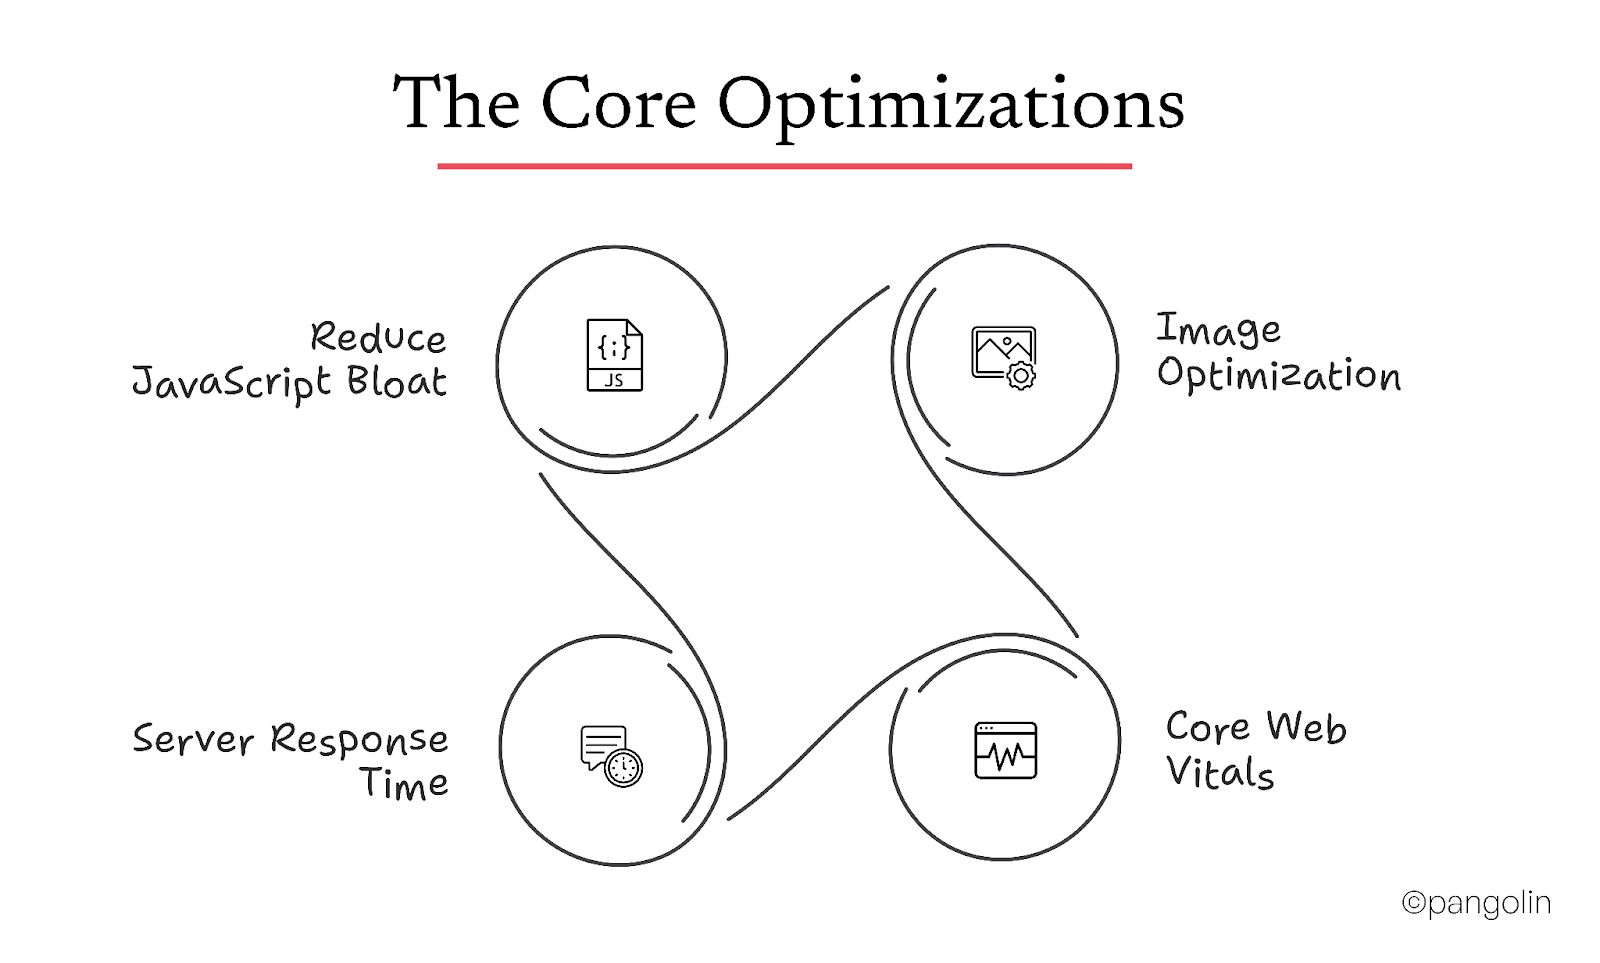
The Core Optimizations
1. Image Optimization
Compress images using TinyPNG or ImageOptim (reduce file size by 60-80%)
Use next-gen formats like WebP (smaller file size, same quality)
Lazy-load below-the-fold images (don't load images until user scrolls to them)
2. Core Web Vitals
Google measures three key metrics:
Largest Contentful Paint (LCP): Time until main content loads → Target: <2.5s
First Input Delay (FID): Time until page becomes interactive → Target: <100ms
Combined: 2.5 hours of work, 40-60% faster page load.
Impact: Companies optimizing to <2s load time see 25-40% improvement in conversion rates.
A 1-second optimization can yield immediate 7-10% conversion lift. That's ROI measured in hours, not months.
Sales-Marketing Alignment: Stop the Blame Game, Build an SLA
Here's the conversation happening in every IT services company:
Sales: "Marketing sends garbage leads. We waste half our time on unqualified prospects." Marketing: "We send qualified leads. Sales doesn't follow up fast enough." CFO: "Why are we spending $15K/month if nothing converts?"
Sound familiar?
The problem isn't sales. It's not marketing. It's the lack of alignment between them.
The Reality
50%+ of qualified leads are rejected by sales as unqualified
Marketing and sales define "qualified" differently
Leads aren't being followed up within the critical 1-hour window
No shared KPIs means no accountability
The fix? Create a formal Lead SLA (Service Level Agreement).
What a Lead SLA Looks Like
Marketing Commits To:
Lead quality threshold: Minimum 40 points on lead scoring model
Lead volume: X leads per month (based on agreed pipeline targets)
Lead handoff process: Leads delivered to CRM within 15 minutes of form submission
Lead enrichment: Company size, industry, job title validated before handoff
Sales Commits To:
First contact within 1 hour of lead handoff
Follow-up cadence:
Day 1: Phone + email
Day 2: Email
Day 3: LinkedIn message
Day 5: Phone
Day 7: Email
Then weekly for 4 weeks
Lead disposition tracking: Mark leads as "Qualified," "Nurture," or "Disqualified" with reason
Feedback loop: Weekly report on lead quality (what worked, what didn't)
Negative Signals (Disqualifiers): -10 to -50 points
Job title: Student = -50 points
Company size: <10 employees = -30 points
Competitor employee = -50 points
Unsubscribed from emails = -20 points
Set Thresholds
MQL Threshold: 40+ points (marketing-qualified, ready for nurture)
SQL Threshold: 70+ points (sales-qualified, ready for direct outreach)
Recalibrate Quarterly
Track which leads actually close. If leads scoring 60-70 points are closing at 25%, but leads scoring 80+ are closing at 40%, raise your SQL threshold to 75 points.
Impact: Companies implementing lead scoring see 30-40% improvement in sales productivity (less time wasted on unqualified leads).
Conversion Rate Benchmarks: Where You Stand (And Where You Should Be)
Let's talk numbers.
Industry data shows IT services companies are underperforming, not because they're bad at marketing, but because the buyer journey is fundamentally more complex.
By May 2016, they were champions. By the time competitors realized what happened, it was too late.
Your IT services company has the same opportunity.
The companies winning right now:
Build role-based landing pages for IT, Finance, Ops, and C-Suite
Implement lead scoring so sales focuses on high-intent prospects
Optimize forms to 4 fields and improve completion by 30-50%
Speed up pages to <2.5 seconds and reclaim 15-25% conversion
Align sales and marketing with formal SLAs
Use case studies as proof points at every funnel stage
The companies still struggling:
Treat every lead the same
Send all traffic to one generic landing page
Ask 8+ fields and lose half their prospects at form submission
Have slow pages that signal poor technical competence
Let sales and marketing blame each other instead of building systems
Avani Nagwann
Co-Founder & CEO, Pangolin
Avani is the co-founder and "Co-Dreamer" at Pangolin, a specialist B2B marketing agency where she leads the firm’s mission to leverage "tech for good."
Shashank Ayyar
Co-Founder, Pangolin
Advises tech founders and enterprises on brand clarity, go-to-market systems, and strategic narrative; builds high-impact marketing engines for B2B SaaS and service companies; advocates for "tech for good" and value-driven growth in the IT sector.
FAQs
What's a good conversion rate for IT services lead generation campaigns?
How long does it take to see results from conversion rate optimization?
Why do IT services companies convert worse than other B2B industries?
Should I focus on generating more leads or converting existing ones better?
How many form fields should I use for IT services lead capture?
What's the best way to handle multiple decision-makers in IT procurement?
How important are case studies for IT services conversion rates?
What causes the sales-marketing misalignment in IT services companies?
How much does page speed really affect conversion rates?
What's lead scoring and do IT services companies really need it?
How do I get sales to stop rejecting marketing leads?
Can smaller IT services companies compete against enterprise competitors for leads?
What metrics should I track for IT services lead gen optimization?
Should IT services companies invest in paid ads or focus on organic?
How do I prove marketing ROI to my CFO when IT sales cycles are 7-10 months?